
Introduction
1.1 Energy and the Modern World
Energy is the master resource. It allows and facilitates all physical work done, the development of technology and allows human population to live in high-density settings like we find in modern cities. Energy consumption correlates directly with the real economy (Bradley & Fulmer 2008). The real economy, which is the part of the economy that is concerned with actually producing goods and services, as opposed to the part of the economy that is concerned with buying and selling securities on the financial markets.
Therefore, it follows that if energy systems and the nature of their true energetic source was to radically change form, virtually everything else would change with it. Currently, Hawai’i, like all other western economies, is heavily dependent on fossil fuels and petroleum products in particular (oil).
There is an international scientific consensus that a rapid shift in global climate conditions is underway and that its negative impacts are being felt around the world. That consensus directly attributes this shift to human economic activity and its use of fossil fuels. This poses a significant conflict of interest since phasing out the use of these fuels within an unprecedented amount of time is mandatory if we intend to mitigate the worst impacts of ‘Climate Change’.
What are the options for the Hawaiian Islands to phase out the use of fossil fuel energy systems? How would those options work? What would their deployment look like? What, if any, would their limitations be? Renewable energy systems have been developed and are currently being deployed with the intent to replace the main applications of fossil fuels as rapidly as possible. In Hawaiʻi these applications include:
· Generation of electricity
· Fuel for Internal Combustion Engine (ICE) vehicles for transport
· Generation of heat for industry
· Feedstock for the production of petrochemicals and fertilizers whether produced locally or imported
Today, the supply chain for approximately 90% of all industrially manufactured products depend on the availability of oil derived products and services. As the primary raw material used to produce various types of high energy density fuels, oil powered transport moves approximately 95% of all global economic activity. Therefore, oil, alongside container ships, trucks, aircraft and information technology form the backbone of globalization and our current industrial ecosystem. (Michaux 2019)
1.2 Energy in Hawaiʻi
Hawai‘i’s energy mix is similar to other places in the world. Hawaiʻi uses electricity for infrastructure and petroleum for transportation. As it is elsewhere around the world, petroleum is shipped to Hawai‘i. However, there are a few differences that make electricity production in Hawai‘i more challenging.
First, Hawai‘i primarily uses petroleum to generate its electricity, while most of the rest of the world has phased that out and now uses coal and natural gas. In recent years, the price of petroleum has fluctuated significantly from year to year due to increasing marketplace demand combined with various geological and geopolitical constraints. To have stable electricity costs, you must be able to minimize the impact of petroleum price fluctuations. Miscalculating the market has costly results.
The fact that Hawai‘i uses petroleum for both electricity and transportation makes this even more problematic. One of the reasons this is the case for Hawaiʻi is that during the Carter Administration, the Power Plant and Industrial Fuel Use Act of 1978, set conditions for Hawaiʻi to be exempted from a national prohibition on the use of petroleum for new power plant design.
Islands, of course, are self-contained and tend to be relatively small in area, and that poses another challenge. Elsewhere, electricity can be consumed hundreds or even thousands of miles from where it is generated. Electricity used on the east coast of the U.S. mainland or in the country’s “heartland” can be produced almost anywhere in the nation. A source of electricity may combine or switch between different locations many times a day. This “load-sharing” allows for greater efficiency and flexibility when balancing supply and demand throughout the day and across broad areas.
Because the Hawaiian Islands are physically isolated from each other, they don’t currently load-share. This has been primarily for economic reasons. Therefore, each island must produce enough electricity to meet its smaller, local, consumer demand, whatever that is, day or night.
That also means each island’s generation facilities must be designed with a load capability that can deliver a clearly defined “peak” in demand. Year-over-year, that peak might only occur 5% of the time. The islands’ differences in geography, small population size, fuel mix, and facility peak capacity demands are among the factors that contribute to Hawai‘i’s high cost of electricity.
1.3 Hawaiʻi, Energy and the Global Economy
The modern world is heavily interdependent. Many of the structures and institutions we now depend upon function in a global context. Again, energy is the fundamental resource that underpins today’s global industrial system (Fizaine & Court 2016, Meadows et al. 1972, Meadows et al. 2004, Hall et al. 2009, Heinberg 2011, Martenson 2011, Morse 2001, Ruppert 2004, and Tverberg 2023).
Energy is utilized by all economic sectors. The industrial sector may be the most difficult to de-fossilize as it requires significant quantities of high voltage, reliably supplied electrical power that is sinusoidally clean. Reliability is demonstrated as the long-term supply of power, available on demand at the same consistency as is supplied from those systems using fossil fuels as their generation feedstock today, i.e., at least 75% of the time it’s needed.
A great deal of work has been done to develop alternative electric power generation, transmission and delivery systems. These include solar power generated from photovoltaic solar panels, solar thermal systems using the focused heat of the sun to make steam, the use of moving water in hydro power generation and higher velocity air flow for wind turbines in linked arrays. Also, there is a school of thought that the future of power generation should be nuclear.
Future projections of global energy demand are typically forecast using historical data. Therefore, future energy resource reserves (supplies) such as petroleum, natural gas or coal have been projected to continue based on past production performance. Demand has been predicted by estimating population growth and from economic trends measured over time as Gross Domestic Product (GDP). Typically, these are formulated without considering any potential limits on resource or energy flows into the global supply chain or their associated costs. (see, e.g., Smil 2017 for details).
The use of fossil fuels like coal, gas, and oil to generate energy in its various forms, all result in carbon emissions. The use of nuclear power to generate electricity has a very different carbon footprint but has its own challenges to remain viable within large scale applications. Renewable sources like hydroelectricity have a very small materials footprint and produce very little carbon pollution (if at all) but can only be leveraged in specific and conditional geographic locations.
1.4 This Report – What, Where, When, Why, & How?
In previous work, the function of energy, and the logistical requirements to phase out fossil fuel-based energy systems and replacing them with non-fossil fuel systems was examined for the United States, Europe, China, and the whole global ecosystem (Michaux 2021a). The methodology surrounding this task was performed by estimating what would be required to replace the entire global energy system as it existed in 2018. To do this, the global industrial ecosystem was defined, and all reported data for industrial actions, number of vehicles and physical work done, was used as a baseline to calculate the number of non-fossil fuel technology systems that would have been needed to perform the same amount of work at that time.
The purpose of this report is to:
· Map out the energy consumption for Hawaiian society and its economic activity during the calendar year of 2019[1]
· Through a series of scenarios illustrate the technological requirements to replace the use of fossil fuels, with each of those uses representing a sector of Hawaiʻi’s 2019 economic activity, i.e., power generation, ground transportation, local maritime operations, etc
· Map out the electrical power requirements for each option, as if they were to deliver the same scope and scale of work as was performed within Hawaiʻi in 2019
The challenges and opportunities Hawaiʻi faces is quite different to other societies.
· Remote location, long supply chains, no access to rail transport
· Heavily dependent on imported petroleum products for energy and transportation
· Little existing industrial capability
· Most manufactured products are imported
· Majority of food is imported
· Considered a strategic location within the contexts of military activity, maritime and aviation transport
· Relatively stable weather with high sun radiance most of the year
· High quality geothermal reserves
· A unique indigenous culture based on traditional values and principles centered on the relationship between people, land, sea and place. This culture has a history of longevity and self-sufficiency.
On this last point, the Hawaiian culture is as remarkable as it is unique. The modern challenges Hawaiʻi faces may well be met for this reason. The cultural history of Hawaiʻi could be seen as a source of strength to unify Hawaiian society in the face of adversity. Polynesians from the Marquesas Islands migrated to Hawaiʻi more than 1,600 years ago. Polynesians were well established on the islands when, about 800 years ago, Polynesians from the Society Islands arrived in Hawaiʻi. Claiming descent from the greatest gods, they became the new rulers of Hawaiʻi. After a time of voyaging back and forth between the Society Islands and the Hawaiian Archipelago, contact with southern Polynesia ceased. During the 400 years of isolation that followed, a unique Hawaiian culture developed. It is still alive and well.
See Section 26, Appendix A: What Does It Mean to be Hawaiian? for a more complete discussion of Hawaiian culture.
This is very relevant within the context of the scenario driven challenges presented in this report. The cultural legacy surviving within an indigenous culture that was founded on the ability to voyage deep into the unknown, establish a stable, functioning, self-sufficient society in an isolated island chain over multiple centuries would be most useful knowledge while facing current realities.
2. Hawaiʻi – A Broad Overview
Hawaiʻi (Native spelling: Hawaiʻi) is the 50th state of the United States admitted into the Union on August 21, 1959. It is an isolated island chain in the middle of the Pacific Ocean, that stretches more than 1,500 miles across the central Pacific Ocean, from the largest island, Hawaiʻi, in the southeast to the Kure Atoll in the northwest.
Figure 1. Satellite image of Hawaiian Islands
(Source: NASA)
The Hawaiian Islands are often known by their eight main islands – O`ahu, Kauai, Hawaiʻi (Big Island), Maui, Moloka`i, Lāna`i, Ni`ihau, and Kaho`olawe – but the state of Hawaiʻi officially recognizes 137 islands, most of which are uninhabited. (State of Hawaiʻi, DBEDT, 2022)
Hawaiʻi's islands, which are the tops of volcanoes that rise more than 30,000 feet above the sea floor, are located about 1,500 miles north of the equator. It is an archipelago of eight major islands, seven of which are inhabited, plus 124 named islets, totaling 6,425 square miles in land area. It is located in the Pacific Ocean in the Northern Hemisphere, mostly below the Tropic of Cancer, about 2,400 miles from California and 3,900 miles from Japan, making them farther from a major landmass than any other island group on earth.
The island of Hawaiʻi is the largest island, with 4,028 square miles in area. The other inhabited islands, in order of size, are Maui, Oʻahu, Kauai, Molokaʻi, Lānaʻi and Ni`ihau. (Source: State of Hawaiʻi Department of Budget and Finance)
Although the largest island in the state is Hawaiʻi Island, most of the state's population lives on the island of Oahu. On all of the islands, population centers cluster at lower elevations in the coastal areas where the weather is mild and access to services is greatest.
See Section 27, Appendix B: Hawaiian Population, for a more complete discussion of this topic.
2.1 The Counties of Hawaiʻi
The State of Hawaiʻi has five governing counties: Honolulu County, Maui County, Kalawao County, Kauai County, and Hawaiʻi County. Only Hawaiʻi County consists of a single island, the Island of Hawaiʻi.
There is only one school district, which is administered by the State. Governor: Josh Green, M.D. Lieutenant Governor: Sylvia Luke Legislature: 51-member House and 25-member Senate Congressional members: U.S. Senators: Brian Schatz and Mazie Hirono U.S. Representatives: Ed Case (Dist.1) and Jill N. Tokuda (Dist. 2)
Descriptions of each county follow:
Figure 2. State of Hawaiʻi - Counties
Hawai`i County
(https://histategis.maps.arcgis.com/)
2.1.1 Honolulu County
Figure 3. Honolulu County
(Source: State of Hawaiʻi Office of Elections - City & County)
Honolulu County includes Hawaiʻi’s third largest and most populated island, Oahu, as well as 63 other islands. Of note are Coconut Island (Mokuoloe), Ford Island (Poka ‘Ailana), Mokolea Rock, Rabbit Island (Manana), Bird Island (Moku Manu), Chinaman’s Hat (Mokoli`i), Goat Island (Mokuauia), The Mokes (Na Mokulua), Flat Island (Popoia)and Sand Island.
For practical purposes, the City and County of Honolulu is the Island of Oahu. Known as the "Gathering Place", Oahu has a land area of 600.6 square miles. It is the center of business and government for the State of Hawaiʻi. Downtown Honolulu is Hawaiʻi's financial center while Waikiki, the world-famous tourist destination, is only a few miles away. The smallest of the four counties in geographical size, it has 69.4% of the State's population. Legally it includes most Northwestern Hawaiian Islands to Kure Atoll which is 1,367 miles from Honolulu.
The government of both the county and city of Honolulu is Mayor, Rick Blangiardi and a nine-member city/county council.
State Government - Honolulu is the capital of the State of Hawaiʻi. The two levels of government in Hawaiʻi are state and county. Counties perform most services usually assigned to cities and towns (fire protection, police, refuse collection, construction and maintenance of streets and other public works).
2.1.2 Maui County
Figure 4. Maui & Kalawao Counties
(Source: State of Hawaiʻi Office of Elections - Maui County)
Maui County is the second largest county in the State, it includes four major islands with a land area of 1,161.5 square miles. In addition to the island of Maui, the county includes 3 other islands: Molokai, Lanai and Kahoolawe.
However, there is an additional county within Maui County, Kalawao County. This county lies along the northern coast of the Hawaiian Island of Molokai. Kalawao County is the least populated county in all of the United States with a population of just 87 people and occupies just 13.2 square miles. Maui Island (772.0 sq. miles), also known as the "Valley Isle", is the economic center and seat of county government. Its flower is the pink cottage rose called loke lani.
Molokai (260.5 sq. miles) also includes Kalawao, a state administered hospital settlement. It is known as the "Friendly Isle" and its flower is the white kukui blossom.
Lanai (141.1 sq. miles), once known as the "Pineapple Isle", is now the home of two luxury resorts. Its flower is the kauna‘oa, a yellow and orange air plant.
Kahoolawe (44.6 sq. miles) is uninhabited. Formerly used as a bombing practice range by the U.S. Navy and Air Force, it is now being restored and replanted. Its flower is the beach heliotrope called hinahina.
The government of Maui County is made up of Mayor, Richard (Rick) Bissen and nine-member county council.
2.1.3 Hawaiʻi County
Figure 5. Hawaiʻi County
(Source: State of Hawaiʻi Office of Elections - Hawaiʻi County)
Encompassing the island of Hawaiʻi and the youngest island in the chain, the “Big Island” was formed by five volcanoes, two of which are still active (Mauna Loa and Kilauea). It is known as the "Big Island" and as the "Orchid Isle".
With a land area of 4,028.4 square miles, it is almost twice the combined size of the other islands. Ka Lae, also known as South Point, is the southernmost point in the United States.
Mauna Kea, which rises 13,796 feet above sea level, is the world's tallest mountain when measured from the ocean floor. It is often snowcapped in winter.
The island flower is a red blossom called pua lehua.
2.1.4 Kauaʻi County
Figure 6. Kauaʻi County
(Source: State of Hawaiʻi Office of Elections - Kauaʻi County)
Kauaʻi County includes the islands of Kauaʻi, Niʻihau and uninhabited Lehua and Kaula. Kauaʻi is known as the "Garden Island" and has a land area of 619.9 square miles. Geologically, Kaua’i is the oldest of Hawaiʻi's major islands and the site of the first Hawaiʻi landing by Captain James Cook in 1778. The summit of Waialeale is among the wettest spots in the world with an average rainfall of 444 inches per year.
Kauaʻi's flower is a green berry known as mokihana. Niihauʻs flower is a small shell called pupu.Niʻihau is privately owned and sometimes called the "Forbidden Island." Public access is allowed only with permission of the owners. Its land area is 67.6 square miles. It has been privately owned by one family for over 150 years, they enacted a closed-door policy in order to create a cultural preservation site for native Hawaiians.
2.1.5 Hawaiʻi Counties – Statistics Summary
Figure 7. The main Hawaiian Islands
(Source: GIS Geography https://gisgeography.com/hawaii-map/ )
2.2 Hawaiian Commerce and Trade
Hawaiʻi's economy is not energy intensive and ranks fifth among the states that use the least energy per dollar of GDP. Major contributors to the state's economy are real estate, tourism, construction, and government, including the U.S. military. See Section 28, Appendix C: Hawaiian GDP, Industry, Foreign Trade, and Commerce, for a more complete discussion of this topic.
2.2.1 Cost of Living – CPI Data
Honolulu, Hawaiʻi's Cost of Living is 88% higher than the national average. The Cost of Living in any area can vary based on factors such as a resident’s career, their average salary, and the expansion or contraction of the real estate market of given areas. See Section 28.1, Appendix C: Cost of Living – CPI Data, for a more complete set of data.
2.2.2 Housing, Utilities, and Transportation
Honolulu's housing expenses are 202% higher than the national average and the Utility prices are 89% higher than the national average. Transportation expenses like bus fares and gas prices are 43% higher than the national average. See Section 28.2, Appendix C: Housing, Utilities and Transportation, for a more complete set of data.
2.2.3 Healthcare
Hawaiʻi has consistently topped the Commonwealth Fund’s scorecard in recent years, often coming in first overall. The state has scored high when it comes to health outcomes and healthy behaviors, health insurance coverage and access to care, despite longstanding concerns about a shortage of providers, particularly in rural areas and the neighboring islands. (Honolulu Star Advertiser-July 2023) Healthcare costs in Honolulu are 25% higher than the national average. See Section 27.1, Appendix B: Healthcare, for a more complete set of data.
2.3 Hawaiian Industrial Production Footprint, Sewerage and Recycling
Hawaiʻi does have some industrial operations, but they are relatively small scale compared to other economies of a similar size. This is because Hawaiʻi is a tourism and service-based economy. See Section 29, Appendix D: Industrial Production Footprint, Sewerage and Recycling for a more complete set of data.
2.4 United States military footprint in Hawaiʻi
The United States military makes up a significant portion of the Hawaiian economic system and therefore its physical footprint.
Hawaiʻi's central Pacific location has held strategic military importance for nearly a century. That alone explains the large military presence there. Historically, Hawaiʻi played a major role as a base of operations during the three major wars in Asia during the twentieth century – WWII, Korea, and Vietnam. (Source: DenixOSD, 2010, Military Presence in Hawaiʻi)
Any future energy planning will require the participation discussion of this strategic interest group.
The criticality of energy to military operations, particularly liquid transportation fuels, cannot be overstated. The effectiveness of any military in combat, but also in-garrison (for training and maintaining readiness) is dependent on the continuous flow of these fuels. The DoD footprint in Hawaiʻi and its role as a major commercial waypoint for fuel and supplies regularly crossing the Pacific Ocean is vulnerable to supply-chain disruptions. See Section 30, Appendix E: United States Military Footprint in Hawaiʻi E for a more complete set of data.
2.5 Land use Mapping of Hawaiʻi
The eight main islands and the more than 100 uninhabited reefs, shoals, and atolls are about 2,400 miles to the West of California and 3,900 miles to the East of Japan, making them farther from a major landmass than any other island group on earth. geographic isolation makes its energy infrastructure unique among the states. Hawaiʻi consumes almost seven times more energy than it produces. About four-fifths of Hawaiʻi's energy consumption is petroleum, the highest share among the states. Hawaiʻi’s islands, which are the tops of volcanoes, some of which rise more than 30,000 feet above the sea floor, are located about 1,500 miles north of the equator. See Section 31, Appendix F: Land Use Mapping in Hawaiʻi for a more complete data set on Hawaiian land area, agricultural land, planning, transport Hubs, energy projects.
Figure 8. Land area in Hawaiʻi, by island in 2010
(Source: U.S. Census Bureau, 2010 Census Redistricting Data (P.L. 94-171) Summary File (February 2011), and calculations by the Hawaiʻi State Department of Business, Economic Development & Tourism, Office of Planning and the Hawaiʻi State Data Center, and unpublished records.)
Table 1. Land area in Hawaiʻi, by island in 2010
2.6 Hawaiian Natural Resources
Section 32, Appendix G: Hawaiian Natural Resources, shows data on solar radiation, wind power density, geothermal energy potential, topography and hydrography in Hawaiʻi.
Section 33, Appendix H: Forests, Endangered Wildlife, Climate Temperature and Rainfall, shows data on forests, endangered wildlife, climate temperature and rainfall.
Section 34: Appendix I: Hawaiian Coastline, shows data on the Hawaiian coastline.
Groundwater provides 99 % of Hawai‘i’s drinking water and about 50 % of all fresh water used in the State. Groundwater recharge is primarily derived from rainfall, however, other sources such as irrigation and leakage from surface reservoirs also replentish aquifers. Groundwater availability in Hawai‘i is affected by changes in precipitation and evapotranspiration, saltwater intrusion related to withdrawals, and contamination from anthropogenic sources.
Changes in climate could meaninfully impact groundwater availability in Hawai‘i. In areas where the climate may become drier over time, reduced groundwater recharge could result in higher salinity in groundwater and reduced baseflow in streams.
Section 35, Appendix J: Water Consumption and Wastewater Management in Hawaiʻi shows Hawaiian freshwater consumption and waste water management.
2.7 Food Production and Consumption
Figure 9. Local food production in Hawaiʻi in 2010 (Source: NASS 2012 Hawaiʻi Statistics, Appendix K)
Figure 10. Net available food in Hawaiʻi after imports and exports in 2010
(Source: NASS 2012 Hawaiʻi Statistics, Appendix K)
Figure 11. GDP in Hawaiʻi by Selected Industries in 2019
Source: Hawaiʻi Appleseed Center for Law and Economic Justice
US Bureau of Economic Analysis
Section 36, Appendix K: Food Production and Commercial Fishing in Hawaiʻi shows a more complete data set showing food production in Hawaiʻi.
3. Primary Energy Use in Hawaiʻi
The science of physics defines energy as “the ability to do work.” (EIA)
This report aims to assess what replacing the fossil fuel components of Hawaiʻi’s energy consumption with non-fossil resources might require while performing the same amount of work. This section examines energy use in Hawaiʻi by its various sources and how those sources have been used within Hawaiʻi’s economy. Our understanding of the options available to achieve that goal today means electrifying all or most of the work required to operate the Hawaiian economy as is possible.
3.1 Energy in Hawaiʻi – Broad Overview
Hawaiʻi requires that 100% of its electricity be generated by renewable sources of energy by 2045. In 2023, about 31% of the state's total generation came from renewables.
Despite having the third-lowest total energy consumption among the states, Hawaiʻi uses almost nine times more energy than it produces.
In 2023, solar power provided about 19% of Hawaiʻi's total electricity, the majority of which was from small-scale, customer-sited solar power generation. Hawaiʻi had the 11th-most small-scale solar generation among the states in 2023.
Petroleum accounts for about four-fifths of Hawaiʻi's total energy consumption, the highest share for any state.
Hawaiʻi has the highest average electricity price of any state and it is nearly triple the U.S. average. The state's electricity use is the fourth-lowest in the nation. (EIA)
3.2 State of Hawaiʻi Public Utilities Commission (2021)
The PUC regulates all chartered, franchised, certificated, and registered public utility companies that provide electricity, gas, telecommunications, private water and sewage, and motor and water carrier transportation services in the State.
The Hawaiʻi Department of Business, Economic Development (DBEDT) monitors the activities across the energy sector and provides reporting and analysis that can influence legislative and regulatory decision making.
Petroleum products refinement, distribution and pricing are regulated at both the federal and state level. Federally, regulation falls under the jurisdiction of the Federal Energy Regulatory Commission (FERC) and the US Environmental Protection Agency (EPA)
3.2.1 Electric Utilities in Hawaiʻi
The Commission regulates four electric utility companies engaged in the production, purchase, transmission, distribution, and sale of electric energy in the State. Each of Hawaiʻi’s six main islands has its own electrical grid, not connected to any other island. Collectively, HECO, MECO and HELCO are known as the “HECO Companies” and serve about 95% of the State’s population. KIUC on the island of Kauai serves about 5%. KIUC is an ‘energy cooperative’ and is owned by its membership. The islands of Niihau and Kahoolawe do not have electric utility service.
Hawaiʻi’s Regulated Electric Utilities’ service areas are:
Hawaiʻi Electric Light Company (“HELCO”), serving the island of Hawaiʻi
Hawaiian Electric Company (“HECO”), serving the island of Oahu
Kauai Island Utility Cooperative (“KIUC”), serving the island of Kauai
Maui Electric Company (“MECO”), serving the islands of Maui, Lanai, and Molokai
3.2.2 Gas Utilities in Hawaiʻi
Hawaiʻi’s Regulated Utility Gas
The Commission regulates the production, conveyance, transmission, and delivery of gas. When the gas pipelines deliver fuel directly to a property, this service is called “utility gas” and is regulated by the Commission. However, sales of gases in cylinders (for example, propane, medical, and industrial gases) are not regulated by the Commission.
Hawaiʻi’s only utility gas provider, The Gas Company (dba Hawaiʻi Gas), serves customers in its six gas districts: Honolulu, Hawaiʻi Island, Maui, Mokokai, Lanai, and Kauai.
3.3 Energy Consumption in Hawaiʻi
Table 2. Energy consumption in Hawaiʻi, by source: 1985 to 2020
Figure 12. Sankey Diagram of Hawaiʻi’s Energy Sources and Uses in 2019
(Source: Lawrence Livermore National Laboratory/Commodities/Energy)
The transportation sector accounts for 43.92% of the energy consumed in Hawaiʻi, the largest portion being in the form of jet fuel and motor gasoline, followed by the industrial sector at 14.15%, the commercial sector at about 10.82%, and the residential sector at 8.7% (Figures 12 & 13). Hawaiʻi's mild climate contributes to the state's residential sector energy consumption being the lowest in the nation.
Table 3. Consumption of energy, by end-use sector: 1960 to 2020
Table 4. LIQUID FUEL CONSUMPTION by County (2019)
Source: Hawaiʻi Energy Data DBEDT Data Warehouse, Liquid Fuel Tax Base
The year 2023 was the most recent year of data available at the time of writing this report. The year of 2007 was a refence year from more than a decade ago, and prior to the Global Financial Crisis (Mathiason 2008 and Kingsley 2012) making them representative of events outside crises that skew data in the short term.
Table 5. Fuel consumption in the State of HawaiʻI
Pre & Post Pandemic Comparisons (2007,2019, 2023)
(Source: Hawaiʻi Energy Data DBEDT Data Warehouse, Liquid Fuel Tax Base)
Figure 13. Consumption of energy in Hawaiʻi by energy source in 2019
(Note: Geothermal energy consumption is 2018 values, 2019 geothermal power plant was shut down See Sec. 3.9)
(Data Source: U.S. Department of Energy, Energy Information Administration, State Energy Data System (SEDS) "State Energy Consumption Estimates, Selected Years, 1960-2020, Hawaiʻi CT2" (June 2022) (https://www.eia.gov/state/seds/sep_use/notes/use_print.pdf)
Figure 14. Consumption of energy in Hawaiʻi, by end-use sector in 2019
(Data Source: U.S. Department of Energy, Energy Information Administration, State Energy Data System (SEDS) "State Energy Consumption Estimates, Selected Years, 1960-2020, Hawaiʻi CT2" (June 2022) (https://www.eia.gov/state/seds/sep_use/notes/use_print.pdf)
Figure 15. Fuel consumption in the State of Hawaiʻi (Liquid fuel tax base)
(Source: Hawaiʻi Energy Data DBEDT Data Warehouse, Electric utility companies)
3.4 Petroleum in Hawaiʻi
Hawaiʻi has no proved crude oil reserves or production, but it does refine crude oil into petroleum products (EIA 2024). The state has one crude oil refinery, Par Hawaiʻi, located in the Honolulu port area on Oahu, which can process about 94,000 barrels of crude oil per calendar day.
Figure 16. Par Hawaiʻi Refinery – Oahu (Image: Par Hawaiʻi)
The refinery's crude oil comes primarily from Argentina, Libya and Brazil (EIA 2024). Par Hawaiʻi supplies much of Hawaiʻi's demand for refined petroleum products. Additional refined petroleum products, including jet fuel, propane, low-sulfur diesel fuel, and motor gasoline, are imported from countries in Asia, the Caribbean, and South America.
Suppliers offload crude oil into storage tanks at the Oahu refinery area through offshore mooring systems and load refined products at Honolulu harbor terminals onto fuel barges for distribution to other islands. Hawaiʻi has no inter-island pipelines, however, there are small pipeline systems on some of the outer islands that distribute petroleum products to and from distribution transport vehicles.
The transportation sector uses almost two-thirds of all petroleum consumed in Hawaiʻi, and the electric power sector uses about one-fourth. Together, the industrial, commercial, and residential sectors make up the remaining one-tenth of the state's petroleum use (EIA 2024).
3.4.1 Jet Fuel Makes Up Nearly Half of Hawaiʻi’s Petroleum Consumption
As of April 2024, the transportation sector consumed nearly two-thirds of all petroleum consumed in Hawaiʻi, the electric power sector uses about one-fourth. Combined, the industrial, commercial, and residential sectors make up the remaining one-tenth of the state's petroleum use (10%). Jet fuel accounts for nearly half of the petroleum consumed in the state.
Figure 17. Hawaiian Airlines Jet approaches Honolulu International Airport
(Image: Hawaiian Airlines)
Because of the significant demand coming from commercial airlines and military installations, jet fuel makes up a larger share of total petroleum consumption in Hawaiʻi than in any other state, with the exception of Alaska.
Motor gasoline accounts for approximately three-tenths of the state's petroleum use. In 2006, Hawaiʻi imposed a requirement that all motor gasoline contain at least 10% ethanol, in part to help spur creation of a local ethanol industry, using locally grown feedstocks. However, no ethanol refineries have been built in the state, and the ethanol blending requirement was terminated in 2016. To help reduce its reliance on petroleum, Hawaiʻi initiated a series of incentives for electric vehicles (EVs), including designated parking spots in public garages, free parking in government lots, at various parking meters, and rebates for installing charging stations (EIA 2023).
Section 37, Appendix L: Petroleum Fuel Consumption and Imports in the State of Hawaiʻi, shows a more extensive data set of Hawaiian consumption and import of petroleum products.
3.5 Natural Gas in Hawaiʻi
Figure 18. Hawaiʻi Gas SNG plant
(Image: Hawaiʻi Gas)
Hawaiʻi has no natural gas reserves and produces no conventional natural gas, but it produces synthetic natural gas (SNG or syngas) (EIA 2023). Hawaiʻi and North Dakota are the only two states that produce syngas. An Oahu processing plant produces syngas, using naphtha feedstock from a local refinery and delivers it via pipeline to parts of Oahu. Renewable natural gas is also produced in Hawaiʻi in the form of methane created by the biogas from decomposing organic matter at a Honolulu wastewater treatment plant.
With its limited supply and distribution network, Hawaiʻi has the lowest total natural gas consumption in the nation and the lowest per capita consumption. In 2022, the commercial sector, which includes hotels and restaurants, consumed 77% of the natural gas in Hawaiʻi. The residential sector accounted for 20% and the industrial sector used 3%. Only about two-fifths of Hawaiian households have heating systems, and very few of those households, about 3%, use gas (or propane) as their primary heating fuel. (EIA 2023)
For information about Natural Gas Fired Power Plants Efficiency see Section 39.4.3: Appendix N
3.6 Coal in Hawaiʻi
Hawaiʻi has no coal reserves and does not produce coal but did receive coal from ocean freighters in the past. Hawaiʻi's coal use began in the 1980s to reduce the state's dependence on petroleum in both the industrial and electric power sectors. Industrial plants used coal to supplement the agricultural waste burned to power sugarcane processing operations, but those operations ceased.
Figure 19. AES Hawaiʻi Power Plant – Oahu
(Image: Honolulu Civil Beat)
Coal was last used by Hawaiʻi's electric power sector in late 2022, when the state's only utility-scale coal-fired power plant (AES Hawaiʻi Power Plant) was retired. (EIA)
For information about Coal Fired Power Plants Efficiency see Section 39.4.2: Appendix N
3.7 Solar Power Generation in Hawaiʻi
Solar power accounted for 58% of the state's renewable electricity generation and 17% of its total generation from all energy sources (EIA 2023). Small-scale, customer-sited solar panel generation was about twice as large as the state's utility-scale solar generation. Hawaiʻi had the 10th-highest small-scale solar generation of any state in 2022. At the beginning of 2023, Hawaiʻi had about 1,100 megawatts (1.1 GW) of total solar power generating capacity, with about 70% of that capacity installed as customer-sited, ‘roof-top’ solar panel systems. There were nearly 97,000 small-scale residential and commercial generating systems on the five island grids operated by Hawaiian Electric (Oahu, Maui, Molokai, Lanai and Hawaiʻi Island).
Kauaʻi’s electric utility, Kauaʻi Island Utility Cooperative (KIUC), is a member owned cooperative that was formed in November of 2002. It is one of America’s newest electric cooperatives; one of approximately 900 electric cooperatives serving electric consumers in 48 states. KIUC operates as a not-for-profit organization that is owned by its members and governed by an elected board of directors. It currently has 6,580 roof-top solar systems in service contributing to a 60.2% renewable energy portfolio. (KIUC)
In 2022, approximately 22% of Hawaiian Electric's residential customers had operating rooftop solar. Hawaiʻi had a net metering program[2], but it closed to new applicants in 2015. The program reached the maximum number of customers it could support sending their excess electricity from their private systems (solar, wind, hydro) to the grid.
Figure 20. Kawailoa Solar Farm, Oahu
(Image: Elemental Energy)
For information about Solar Power Plants Efficiency see Section 39.4.7: Appendix N
The state's largest solar energy project to date began operating on its 450-acre project site in Central Maui at the end of May 2024. The AES Hawaiʻi's Kūihelani Solar-plus-Storage facility has 60 megawatts of generating capacity, reportedly enough to power up to 27,000 homes, and 240 megawatt-hours of lithium-ion storage.
Hawaiʻi's second largest solar farm, Kawailoa Solar on the island of Oahu, went online in late 2019 deploying more than 500,000 solar panels (Hawaiʻi Land Use Commission), and has a generating capacity of about 49 megawatts. Another one of the state's newest solar farms, Mililani 1 Solar, its third largest with 39 megawatts of capacity began operating in mid-2022.
Starting in 2010, Hawaiʻi’s state building codes require all new single-family homes to include solar hot water heaters (with some exceptions).
3.8 Wind Power Generation in Hawaiʻi
Figure 21. Hawi Renewable Development Wind Farm, Hawi, Hawaiʻi
(Image: Peter Sternlicht)
Hawaiʻi has significant onshore and offshore wind resources. Wind energy generated 20% of the state's renewable electricity and 6% of its total electricity in 2022. The state has 233 megawatts of installed generating capacity at eight utility-scale wind farms (EIA 2023). Hawaiʻi currently has no offshore wind power turbines, although several energy developers have proposed offshore wind projects targeting federal waters around Oahu. The U.S. Bureau of Ocean Energy Management sought additional proposals from companies interested in offshore commercial wind energy leases. For information about Wind Power Plants Efficiency see Section 39.4.6: Appendix N
3.9 Hydroelectricity in Hawaiʻi
Hawaiʻi does not have rivers with large water flows that can support hydroelectric dams, but the state still produces some hydropower. The small hydroelectric turbines in use are ‘run-of-river’ and ‘run-of-the-ditch’ systems at sites on Maui, Kauai, and the Big Island. Hydropower provided about 4% of the state's renewable generation and 1% of total generation from all sources in 2022. Studies have identified other potential sites for small hydroelectric projects in the state.
Figure 22. Lower Waiahi Hydropower Plant
and re-enters Waiahi Stream
(Image: KIUC (Kauai Island Utility Cooperative)
3.10 Biomass, Biodiesel & Waste to Energy in Hawaiʻi
As with Hydropower, Biomass, Biodiesel and Waste to Energy all play a role in Hawaiʻi’s energy landscape, however each is small relative to the state’s power demand.
3.10.1 Biomass
Hawaiʻi has what is believed to be the world's largest commercial power generator fueled exclusively with biodiesel (EIA 2023). Biomass accounted for 9% of the Hawaiʻi's renewable generation in 2022 and slightly less than 3% of the state's total generation. Biomass, mainly agricultural wastes such as bagasse from sugarcane, has long been used in rural Hawaiʻi to generate heat and electricity. However, that source of biomass declined with the closure of many sugar plantations.
A new biomass facility, Hu Honua Bioenergy, located on a former Big Island sugar plantation, planned to burn local forest waste to generate electricity. However, that project was subsequently denied a power PPA (Power Purchase Agreement) with Hawaiian Electric, the state power utility, in a ruling by the Hawaiʻi Supreme Court in March of 2023.
Figure 23. Hu Honua Bio Energy biomass power plant,
Pepeʻekeo, Big Island, Hawaiʻi
(Image: Kuʻuwehi Hiraishi/Hawaiʻi Public Radio)
3.10.2 Biofuels
Biofuels also play an important role in Hawaiʻi's power generation. Pacific Biodiesel is the only producer of biodiesel in Hawaiʻi. It has a production capacity of 6 million gallons per year. It is also the longest operating biodiesel plant in the US. The 120-megawatt Campbell Industrial Park Generating Station, which began service on Oahu in 2010, is believed to be the world's largest commercial power generator fueled exclusively with biodiesel.
Figure 24. Pacific Biodiesel, Keaʻau, Big Island, Hawaiʻi
(Image: Pacific Biodiesel)
3.10.3 Waste to Energy
Currently, Honolulu's 90-megawatt waste-to-energy power plant, (Covanta / H-Power), which uses municipal solid waste to generate nearly one-tenth of Oahu Island's electricity, provides most of the state's biomass-fueled electricity Several other smaller waste-to-energy and biomass generators operate on Oahu and Maui.
Figure 25. H-Power – Waste to Energy plant – Oahu
(Image: City and County of Honolulu)
In May, 2015, H-POWER opened a first-of-its-kind sewage sludge receiving station that injects sewage sludge directly into the facility’s mass burn unit where it is diffused into the refuse for incineration. This enables the City to redirect more than 40,000 tons per year from the landfill; 20,000 tons of sewage sludge along with 20,000 tons of bulky waste which had to be combined with sludge to settle it properly in the landfill. The 40,000 tons of additional bulky waste and sewage sludge will be converted into the energy equivalent of 20,000 barrels of oil, generating enough electricity to power 1,500 homes. (City & County of Honolulu)
3.11 Geothermal in Hawaiʻi
Hawaiʻi is one of seven states with utility-scale electricity generation from geothermal resources, which provided about 10% of the state's renewable electricity and about 3% of total power supplies in 2022 (EIA 2023). The state's single geothermal power plant, the Ormat owned Puna Geothermal Venture (PGV), is located in the Big Island’s East Rift Zone of the Kilauea Volcano.
PGV temporarily shut down in May 2018 after ground fissures and lava flows blocked access to it during an eruption. In November 2020, the plant came back online. Ormat’s plans include increasing the capacity of the plant from 38 megawatts to 46 megawatts by installing upgraded power-generating systems.
PGV is currently permitted to expand it production to 60 megawatts, which is 14 MW more than its current contractual capacity commitment (46 megawatts) to Hawaiian Electric. Late in 2024 they are engaged in what is termed The Puna Geothermal Venture Repower Project which aims to increase power production of the existing power plant from 38 to 46 MW in ‘Phase 1’ and further increase production to 60 MW in Phase 2. The current proposal is to replace the 12 operating power-generating units with up to four, state-of-the-art, modern technology generation units.
Figure 26. Puna Geothermal Venture (PGV)
Big Island, Hawaiʻi
For more detailed information about Geothermal Energy, see SECTION 48: APPENDIX X
3.12 Ocean Energy in Hawaiʻi
Ocean Energy in Hawaiʻi has not yet progressed beyond an experimental research phase. The Hawaiʻi Natural Energy Institute (HNEI) has a long history of research and development in ocean energy and resources technology, primarily in wave energy and in Ocean Thermal Energy Conversion (OTEC).
Figure 27. Makai Ocean Engineering – OTEC Generation Facility (100 kW+ Capacity),
HOST Park, Kona Hawaiʻi
Source: Electronic Engineering Journal, Image credit: Steve Leibson
At present, OTEC-related research is primarily carried out through HNEI’s relationship with Makai Ocean Engineering at the active OTEC research facility at NELHA / HOST Park on Hawai‘i Island.
Emerging ocean energy technologies have the potential to contribute significantly to Hawai‘i’s and the nation’s future energy mix. HNEI supports the Navy’s development of the nation’s first grid connected Wave Energy Test Site (WETS) at Marine Corps Base Hawai‘i, (Oahu) to conduct independent analysis for wave energy conversion device systems performance and associated environmental monitoring. (HNEI)
For more detailed information about Ocean Energy, see SECTION 39.4.5: APPENDIX N
4. Historical Electricity Generation and Consumption
The majority of Hawaiʻi’s electricity is currently generated using fossil fuels, however, renewable energy accounts for a rapidly growing share. For the first time, starting In 2014, petroleum fueled less than 70% of the state's total electricity generation from utility-scale (1 megawatt or larger) and small-scale (less than 1 megawatt) generating systems due to the growth in solar deployment. By 2022, petroleum's share of state generation was down to 62%. Hawaiʻi utilities plan to retire more of their petroleum-fired generating capacity and add renewable generating systems and related battery storage. Coal fueled 6% of the state's generation, and total generation from coal was the lowest since 1992. However, that ended in September 2022 when the state's last coal-fired power plant, the AES owned and operated Barbers Point Plant, a 180-megawatt facility on Oahu, closed as required by state law as part of Hawaiʻi's mandate to transition to 100% electricity generation from renewables. The state has no natural gas-fired or nuclear-powered generation plants.
Figures 28 shows the current assessment of Hawaiʻi’s progress in meeting it’s legislated mandate known as RPS 2045 goal of 100% renewable electricity generation by the year 2045.
Figure 28. 2023 Renewable Portfolio Standard – Status Report
Source: Hawaiian Electric (2024)
Section 38, Appendix M: Hawaiʻi Electricity Consumption shows more data on Hawaiian electrical power generation. Section 39, Appendix N: Different Kinds of Energy: How They Are Generated and Applied, describes how these systems work.
Tables 6-1 through 8 show Hawaiʻi’s generation of electricity by source, price comparison with mainland US, price tracking with petroleum and then consumption by application in Hawaiʻi for the reference year 2019 as stated in Section 1.4.
Table 6-1. Hawaiian electricity production by source and by island in 2019
Source: U.S. Department of Energy, Energy Information Administration, State Energy Data System (SEDS)
Table 6-2. Hawaiian electricity production by source and by island (cont’d) in 2019
Table 7. Electricity sold by application in Hawaiʻi (2007,2019, 2023)
(Source: Hawaiʻi Energy Data DBEDT Data Warehouse, Electric utility companies)
Table 8. Electricity sold by county in Hawaiʻi
(Source: Hawaiʻi Energy Data DBEDT Data Warehouse, Electric utility companies)
Figure 29 shows that in 2020, most of the electrical power generated in Hawaiʻi was generated with petroleum derivatives. The cost of electricity generation in Hawaiʻi has been more expensive as compared to the rest of the United States and shown in Figures 30 and 31. Figure 32 shows Hawaiʻi’s relative dependence on petroleum as compared to each state in the US. Figures 33 and 34 illustrate trends in power consumption from 2006.
Figure 29. Electricity generation in Hawaiʻi in 2020
(Source: U.S. Department of Energy, Energy Information Administration, State Energy Data System (SEDS)
Figure 30. Hawai‘i’s electricity prices are more than double the U.S. average
(Source: HSEO 2020)
Figure 31. Visible Correlation Between Prices of Crude Oil, Gasoline, and Electricity
(Source: HSEO 2020)
Figure 32. Dependence of States on Petroleum for their Energy Needs, 2018
(Source: HSEO 2020)
Figure 33. Electricity sold in the State of Hawaiʻi between 2006 and 2021
(Source: Hawaiʻi Energy Data DBEDT Data Warehouse, Electric utility companies)
Figure 34. Electricity sold all sectors
(Source: Hawaiʻi Energy Data DBEDT Data Warehouse, Electric utility companies)
In 2015, the Hawaiʻi legislature (HB 623) amended the state's renewable portfolio standard (RPS) and made Hawaiʻi the first state to set a legally required deadline, 2045, to obtain 100% of its electricity sales from renewable energy sources (EIA March 2023)
The legislature amended the RPS again in 2022 (H.B. 2089), basing the RPS targets on electricity net generation instead of electricity sales starting in 2030. The Hawaiʻi Public Utilities Commission (PUC) set a separate energy efficiency standard (authorized under HRS §269-96) to reduce the state’s annual electricity consumption by 4,300 GWh by 2030. Originally, the energy efficiency standard was part of the RPS, but, in 2015, the standards were separated because of the different technologies and measurements required to assess each goal.
Future Energy Consumption - Electrification[1], [2]
All global economic activity requires energy to function. Nearly 80% of the ~164K TWh of primary energy consumption in 2023 came from fossil fuels. This energy is extracted, generated, transported, delivered and consumed in two distinctly different forms: as electricity or liquid transportation fuels such as gasoline, diesel, or jet fuel. For nearly 200 years these fossil fuels have served as the dominant source of energy for a continuously growing global economy.
Figure 35. Climate Change/CO2 Emissions Responses (Image: Canva)
However, in the last 30 years the worldwide climate crisis has motivated nations around the world to consider reducing fossil fuel use in favor of non-fossil, carbon-free alternative sources of energy. Hawaiʻi, too, has responded to this crisis by enacting legislation (HRS §269-92) whereby the replacement of fossil fuels used to generate power for it electrical grid has been mandated using clearly defined renewable energy resources (HRS § 269-91). Progress toward achieving this goal for existing grid-power is well underway. Transportation is set to follow suit in order to meet the additional requirements of HRS §225P-5, achieving “Carbon Negative” emissions by 2045.
Further near-term goals have been codified into law via Act 238 (HB 1800, 2022) which “… affirms Hawai‘i’s role in the nationally determined contribution under Article 4 of the Paris Agreement for the United States to achieve a fifty to fifty-two percent reduction in economywide greenhouse gas emissions (GHG) by 2030 compared to 2005 levels”. Most of the additional energy required to achieve this goal will be consumed within the transportation sector.
As will be shown throughout the course of this report, achieving these goals will likely increase existing power demand by a factor of three.
Figure 36. Traffic on H1, Honolulu, HI (Image: Canva)
Planning an effort of this scale involves estimating multiple component factors which compare, contrast and project the current state of energy consumption, electrical and liquid, with what is likely to be needed. It is reasonable to conclude that significant technical and structural modernization will be required along with legislative modernization if these mandates are to be realized in practice. Assessing the tasks to achieve these mandates will include:
1. Quantifying the total work performed using fossil fuels in Hawaiʻi’s current economic system. (Metrics detailed in Section 5.2).
2. Exploring what future systems might be capable of performing the same amount of work delivered by the current system but without the use of fossil fuels.
3. Evaluating options for producing and delivering the energy required to perform that quantity of work in the future. (Options-Scenarios are explored in Sections 10 through XX)
4. Assessing execution feasibility of legislative mandates within their specified time-constraints. This will require adopting modernized regulations that will facilitate those time constraints.
5.1 The Electrification of Transportation
Transportation is widely acknowledged as the most difficult economic sector to electrify. Hawaiʻi’s transportation sector consumed about 57% of the primary energy used in 2019. (HSEO, Clean Energy Vision, Transportation)
The current global climate mitigation strategy is for all modes of transportation to replace their liquid fossil fuel fleets with fleets that are powered by fuels that originate as renewably generated electricity. Assessing the quantity of additional electrical power generation and the new connective infrastructure that task may require is one of this report’s primary missions.
Figure 37. Transportation for the Global Economy (Image: Canva)
Hawaiʻi’s near-term energy transition strategy is focused on ‘Decarbonization’ (HSEO Clean Energy Vision, 2024) in accordance with its legislative mandates and declared net-negative emissions targets (SCR 44 S.D.1, 2021). The form that currently takes is retiring fossil fuel burning power generation plants while deploying new solar farms with 4-hour energy storage systems. Overall systemic growth to support broad electrification of transportation is in the planning state.
While Hawaiʻi’s decarbonization mandates have been considered ambitious (Project Finance, 2017), it has been claimed that the rate at which fossil fuel generation has been retired has outpaced the rate needed to maintain reliably meet ongoing energy demand. (Utility Dive, 2024)
This initial phase primarily leverages an existing transmission and distribution infrastructure that serves a fixed location consumption base. There is a nascent effort to incentivize the adoption of light duty electric vehicles (automobiles, vans and pickup trucks) while building out a charging network to support them has been met with difficulties (Honolulu Civil Beat-2024).
It is reasonable to conclude that any meaningful electrification of Hawaiʻi’s transport system within the timeframes set forth by the existing ‘RPS 2045’ and ‘Carbon Negative’ legislation will require accelerated replacement of existing vehicle fleets, and an expedited development of a charging network required to service it. This in turn will require increased generation capacity, a capacity that the state’s utility already struggles to meet.
It should be noted that Act 155 of 2009, codified under HRS §269-96, established EEPS in Hawaii with a statewide goal of 4,300 gigawatt-hours (“GWh”) of electricity savings by 2030. The practical definition of “savings” and its potential impact on fulfilling the requirements of RPS 2045 and the Carbon Negative legislation remain unclear.
Notwithstanding the foregoing, the scope of Hawaiʻi’s future energy transition will likely involve:
1. Construction of new power generation capacity multiple times greater than is currently deployed and an appropriately scaled grid expansion to support the additional demand load.
2. Building Charging Networks for BEVs that have a similar accessibility as is found with existing liquid fossil fuel networks.
3. Regional deployment of economically viable Hydrogen production and its associated connective infrastructure.
4. Localized fueling networks for Hydrogen and its derivatives anticipating ground, maritime and aviation needs. The post-hydrogen production production operations may include the following:
a. Liquid Hydrogen Production
b. Ammonia Production
c. Methanol Production
d. Other Liquid Organic Hydrogen Carriers (LOHC’s)[3] Production
e. Point to point transportation for all of the above.
It is important to keep in mind that new generation, distribution, and end use replacements for those systems supporting carbon-free liquid fuels have not been widely developed. There are likely to be significant learning curves at all levels of manufacture, deployment, operations, and maintenance, adding to the time required for successful integration within local and global economies. It is also likely that without statutory modernization, the existing regulatory environment may discourage the private sector development financing needed to meet existing mandates. This is another source for comment
5.2 Analysis - Scope and Quality
Each year, the State of Hawaiʻi publishes categorized historical data detailing its economic and demographic variations. This data is gathered by multiple agencies, each of which have multiple areas of focus. The scope of their research has remained constant for decades, within a generalized mission which ‘includes statewide economic development; energy consumption and management; and research. Most of the data used in this report has been provided by state agencies directly or via Federal agencies reliant upon state reporting and is cited accordingly.
As Hawaiʻi seeks to phase out the use of fossil fuels, a goal that will require years of planning and significant investment, assessing the overall transportation energy consumption by system type and fuel type (truck, transit bus, automobile, SUV, gasoline, diesel, biofuel, electricity, etc), the quality, granularity and consistency of data regarding those specific systems is critical to the quality of that planning.
Figure 38. Transportation Analysis (Image: Canva)
Where possible, the procedure for estimating future energy requirements[4] has been performed in multiple ways seeking to substantiate their underlying assumptions. Separate analyses have been performed from both a “Top-Down” (energy content) and “Bottom-Up” (work performed, i.e.: distance traveled by specific system type) approach. (See descriptions in Sections 5.2.5 and 5.2.6)
The combination of bottom-up and top-down approaches constitutes a long-standing challenge in applied energy policy analysis. The terms`top-down'' and ``bottom-up'' are shorthand for aggregate and disaggregated models[5].
“Top-down models examine the broader economy and incorporate feedback effects between different markets triggered by policy-induced changes in relative prices and incomes. They typically do not feature technological details of energy production or conversion. Energy sectors – like other non-energy sectors – are mostly represented in an aggregate way by means of smooth production functions which capture substitution (transformation) possibilities via substitution (transformation) elasticities. As a consequence, conventional top-down models cannot readily incorporate different assumptions about how discrete energy technologies and costs will evolve in the future; top-down models may also violate fundamental physical restrictions such as the conservation of matter and energy. In contrast, bottom-up models -- usually cast as mathematical programming problems – describe current and prospective technologies in detail.” (Christoph Böhringer and Thomas F. Rutherford, 2006)
5.2.1 Data Sourcing and Baseline Data Boundaries
To satisfy the legislative mandates described in Section 5, an assessment of the state’s total energy consumption is necessary. That requires establishing a representative baseline for Hawaiʻi’s transportation energy consumption categorized by vehicle type, fuel type, and thermodynamic efficiency. From there, estimating the equivalent electric power generation capacity needed to deliver the same amount of work as the liquid fossil fuels currently in use can be calculated.
Figure 39. Analyzing Theoretical Chemistry, Volumes and Energy Potential (Image: Canva)
The analysis performed in this report established its baseline energy consumption data using statistics sourced from the State of Hawaiʻi’s Department of Business, Economic Development and Tourism (DBEDT), the Hawaiʻi Department of Transportation (HDOT) and agencies within the US Department of Energy (USDOE/EIA)[6]. The data gathered included total sales of all petroleum fuels as well as electricity sent to the grid by generation type. The data additionally provides vehicle registrations and estimated miles driven by vehicle class. However, historical data supporting the depth of analysis sought by the authors of this report was not found to be available through the State’s data reporting agencies.[7] Therefore, where possible, reasonable, qualified assumptions have been used and noted to establish metrics for our estimations.
5.2.2 Continuity When Comparing Energy Content by Source & Type
Assessing what is needed to phase out the use of fossil fuels requires clarity as to what the energy-content of various energy resources are and how much of that energy performs work. Critically, this comes into play when primary energy resources are transformed into secondary energy resources. Transformation results in losses because the process of transformation itself consumes energy.
Examples of primary energy sources[8] include fossil energy like petroleum, coal, natural gas, and nuclear, solar, wind energy, hydro, geothermal and (potentially) ocean energies. Examples of secondary energy include electricity, hydrogen, gasoline, diesel, refined biofuels, LNG, CNG, LPG. Each form has a definable but varying energy density available to perform work.
Figure 40. Analytic Process (Image: Canva)
Comparing one energy type with another requires common metrics to define relative energy content by volume and/or weight. To satisfy that condition the following measurements are used interchangeably to describe energy equivalencies in their different forms: (EIA)
· BTU – British Thermal Units: is a measure of the heat content of fuels or energy sources. One Btu is the quantity of heat required to raise the temperature of one pound of liquid water by 1° Fahrenheit (F) at the temperature that water has its greatest density (approximately 39° F)
· Joule - The meter-kilogram-second unit of work or energy, equal to the work done by a force of one newton when its point of application moves through a distance of one meter in the force direction (equivalent to 107 ergs and one watt-second).
· Kilowatt-Hour - A measure of electricity defined as a unit of work or energy, measured as 1 kilowatt (1,000watts) of power expended for 1 hour. One kWh is equivalent to 3,412 BTUs.
o Megawatt-hour (MWh), Gigawatt-hour (GWh) and Terawatt-hour (TWh) are measures of electrical generation or consumption that are orders of magnitude greater in quantity expressed over units of time, most commonly, in hours.
· Volume / Weight
o Liquid (volume)
§ Gallons (Imperial)
§ Liters (metric)
o Solid (International norms state these in metric units)
§ Kilograms (kg) – 1,000 grams
§ Tonnes (mt) – 1000 kilograms
§ Cubic Meters
5.2.3 Energy-content and Work Equivalency – By Fuel Type
Performing the same amount of work as is performed by liquid fossil fuels with various forms of electricity requires assessing the power generation required to deliver that work. To do this will involve using different systems that are powered using different forms of electrical ‘energy carriers’[9] and operating in a different economic environment. Using widely held standards of energy equivalents can facilitate these types of calculations. The following table (Table 9) shows the common conversion equivalents by fuel type used in this report (Source: EIA). Their definitions can be found in Section 5.2.2.
Table 9. Energy-content Conversion Equivalents
5.2.4 Top-Down Analysis (Definition)
Petroleum comprises approximately 81% of primary energy use in Hawaiʻi. Electric power generation consumes approximately 32%, transportation consumes 57% and 11% is spread between industrial, commercial, and residential direct consumption (DBEDT, Energy Data and Trends, 2023).
Figure 41. Petroleum Super Tanker at Sea (Image: Canva)
While the systems that consume petroleum are varied and complex, a general, statewide, energy-content-to-work output equivalency can be broadly calculated using a Top-Down Analysis. The top-down analysis approach begins by taking the total fuel consumption figures as reported by the state in 2019[10]. It then converts each fuel type to its equivalent measurement as total thermal energy content (BTU) or the maximum potential energy available to perform work.
This thermal energy’s potential is further correlated to resultant mechanical work by factoring in Overall Thermal Efficiency (OTE)[11] and the associated Internal Combustion Engine (ICE) drivetrain losses to calculate the estimated work performed by the mechanical systems. That total is then converted to a measure of electrical power generation required (kWh) needed to perform that work using a comparable electric system. Tables 10-1 through 10-5 show a procedural breakdown of these calculations for various fuels and uses.
For example, while a gallon of E10 gasoline may contain 122.4k BTUs of thermal energy (Table 9), a typical gasoline engine has an OTE of approximately 21%. The work performed by that gallon of E10 gasoline (driving a car down a road, powering a generator, etc.) starts out as 122.4k BTU but only delivers 25.7k BTU or 7.5 kWh of work once that potential energy moves an average ICE vehicle.
A similar conversion was performed for diesel fuel[12], LNG, Jet-A, etc. The summation of all categories of fuel type yields a total work performed by all transportation-based fossil fuel consumption in the 2019 baseline as kWh using both known and reasonably assumed systems’ power consumption efficiency factors.
Once total work in the baseline is determined, modeling a future system able to deliver equivalent work using electricity must be estimated while assigning the proper thermodynamic efficiencies to various future systems. The proposed future systems assumed in this analysis is as follows:
1) All light-duty road transport vehicles (LDVs) are assumed to be “battery electric vehicles” (BEVs). All heavy-duty vehicles (HDVs) are assumed to be hydrogen (H2)[13] primarily using fuel-cell (FC) electric engines. (Hybrid H2 / Battery HDVs are in development[14])
2) Inter-island marine shipping is assumed to be H2 fuel cell powered vessels.
3) Aircraft are assumed to be H2 fueled, jet-turbine powered. For inter-island flights, BEV or H2 FC powered propeller craft may be viable, but long-haul, (transcontinental, transoceanic) flights will require new technologies and assumes blended wing (BWB) aircraft body design[15], engineering and fuel efficiency will improve 20% over the 2019 baseline used as a placeholder for these new technologies (.48 vs .40 OTE).
Given a modeled future system, conversion efficiencies (losses) must be assigned to that system to determine the total energy production required. These losses must consider the following factors:
1) Energy Storage, Round-Trip (I/O) Efficiency: This considers both short (<4 hours) and long (>4 hours to months) duration energy storage as is typical with BEVs and stationary, grid storage. Since assumed future technology systems include both BEVs and hydrogen-based energy consumption, an opportunity exists to leverage the hydrogen for long-duration, grid energy storage. This provides a flexible grid design that can adapt over time as required.
2) Transmission / Distribution (T&D) Efficiency: This considers line losses during transmission over the grid and assumes the same overall losses as reflected in the 2019 baseline data.
3) Local Energy Storage Charging Efficiency: This category of losses includes losses such as what is incurred while charging a BEV battery or electrolyzing and compressing hydrogen for use with ground / aircraft / marine transport systems.
5.2.5 Bottom-Up Analysis (Definition)
A Bottom-Up approach was conducted only for “Road Transport”[16]. It was performed using data provided by both The Hawaiʻi Department of Transportation (HDOT) and Hawaiʻi’s Department of Business, Economic Development and Tourism (DBEDT). This approach uses statewide reported vehicle registrations and assumes reasonable fuel efficiencies (mi/gal / km/l) and annual Vehicle Miles Traveled (VMT) as reported by HDOT.[17] Assigning these values allows the estimation of the annual fuel consumed for each vehicle type. This process was repeated for each vehicle type and the total fuel consumed. Calculation Model 1 was appropriately validated by comparison with the reported total fuel sold as reported by the state. (CITE SECTION VALIDATION IS SHOWN)
As stated in Section 5.2.1, a Bottom-Up Analysis is desirable because it facilitates an understanding of typical vehicle use as it operates within a known economy and therefore its associated fueling dynamics. It is assumed that these dynamics must be analyzed to efficiently design the interconnected relationships between power generation and energy distribution. Those dynamics will materially differ from today’s existing liquid fuel transportation paradigm.
Figure 42. Pumping Fuel into a Truck Fuel Tank (Image: Canva)
· It should be noted that any Bottom-up Analysis intending to estimate the power needed to phase out the use of liquid fossil fuels in transportation and additionally, for the purpose of modernizing regulatory and economic public policy, requires a statistical record that has greater granularity than is currently available. This would include, but not be limited to, an accurate accounting of the number of vehicles in each county by classification; accurately reported distances traveled by each (on-hwy, off-hwy, taxed or non-taxed); the types of fuels they consume and the purposes for which they are used.
· Without data of this specificity, a high-level assessment of future transportation energy needs and the scope of its generation, transmission, delivery, storage, and derivatives manufacturing infrastructure is not possible. Each island operates autonomously with respect to energy generation and consumption, necessitating reasonable modeling to conform to the economic activity of each.
· To simulate this manner of consumption, Calculation Model 2 uses assumptions and estimates which have been derived using Vehicle-Miles-Traveled (VMT) data by vehicle classification (HDOT); vehicle registration by fuel type statistics (DBEDT); and fuel efficiency baselines by vehicle type (US Department of Energy, Alternative Fuels Data Center).
5.2.6 Analytical Approach – Summary
It should be assumed estimations in this report will be conservative for the following reasons:
The Analysis Reference year was 2019.
Improvements in battery technology have already been realized and are anticipated to continue over coming decades (S&P Global) .
Population trends suggest that growth will continue (UN, 2021, 2022) therefore an increased energy demand is a reasonable expectation.
Energy requirements to build, develop and deploy supporting infrastructure are not examined in this report.
Currently, gasoline and diesel fuel represent most of the fuel consumption for road transport with modest contributions from EVs, LPG, etc. Good agreement was found between the Top-Down model and the actual fuel consumption for gasoline, however, that was not possible for diesel in the Bottom-Up analysis.
The reason for this is the reporting of diesel fuel consumption shows separate categories for both “Hwy Use” and “Non-Hwy” (Table 4) was made without accompanying number of vehicles references (Table 11) or vehicle’s VMT (Table 15). Heavy off-road equipment such as bulldozers, excavators, etc. use a significant amount of fuel[18], but their consumption data are not reported by DBEDT or HDOT.
Additionally, we found no published clarification whether “Non-Hwy” included oil products for electrical power generation. Therefore, a fuel consumption model in the same sense as gasoline powered passenger vehicles cannot be proposed.
Similar issues were found with both marine shipping and air transport such that no bottom-up analysis can be made for those transport systems.
Therefore, the Bottom-Up analysis will only examine consumption and electrification estimates for DBEDT reported road transport using HDOT reported DVMTs. Calculations for a county-by-county consumption estimate uses proportional values of statewide vehicle registrations applied to a statewide VMT average by vehicle class.
Each vehicle type is assumed to be replaced with a BEV equivalent. Calculations for all BEV vehicle fuel efficiency include factors that offer efficiency gains that come from features such as regenerative braking, low rolling resistance tires, better aerodynamics, and potential efficiency losses from increased vehicle weight (battery storage). Mileage efficiency data used in this report cites referenced commercially available manufacturer and published USDOE/USDOT data.
5.3 Top-Down Analysis – Liquid Fuel Consumption & Power Equivalence
As defined in Section 5.2.4, the top-down analysis approach begins with the total liquid fuel consumption[19] (Table 10-1) as reported by the state (DBEDT) in 2019 (Table 4) and converted to an energy equivalent expressed as thermal energy (BTU). This thermal energy is also combined with the appropriate systems’ Overall Thermal Efficiency (OTE) factors and the associated Internal Combustion Engine (ICE) drivetrain losses to calculate the estimated work performed by each fuel type (Tables 10-2 through 10-4). That result is then used to calculate a measure (kWh) of power generation capacity required (Table 10-5) to deliver the work performed by those liquid fuels. Note: this assumes round-trip energy losses encountered with both stationary grid battery storage and vehicle battery storage to achieve transportation’s required energy portability.
Table 10-1. Liquid Fuel Tax Base
ENERGY EQUIVALENCY as BTUs, by Fuel Type, By County
(Reference: Section 3. Table 4 and Section 5.6.1, Table 11)
Table 10-2 shows the BTU value shown in Table 10-1 further equated to thermal energy expressed as thermal kilowatt hours (kWhth). The calculation is performed by applying the known energy content factor to the gallons consumed for each fuel type.[20] (EIA)
Table 10-2. Liquid Fuel Tax Base
ENERGY EQUIVALENCY as THERMAL kWh’s (kWhth),
by Fuel Type, By County
(Reference: Section 3. Table 4)
Table 10-3 shows the energy equivalency shown in Table 10-2 as mechanical work performed. This is calculated by applying a reasonably estimated general systems’ mechanical efficiency factor[21] to the estimated thermal energy shown in Table 10-2. This measurement is expressed as kWh. (Source: Needham, C. (2024)
Table 10-3. Liquid Fuel Tax Base
ENERGY EQUIVALENCY as MECHANICAL WORK PERFORMED as kWh’s,
by Fuel Type, By County
(Reference: Section 3. Table 4)
Table 10-4 shows the vehicle battery charge capacity needed to deliver the power required to perform the work shown in Table 10-3. The charge capacity is expressed as the total power required (kWh) and is measured as the power consumed between the charging system’s electric meter and the final work performed by the vehicle’s electric motor. This measurement is calculated by applying a reasonable estimated power requirement to the value shown in Table 10-3. The resulting quotient includes a reasonable factor for round trip energy losses experienced between the meter and the final work output of EV’s motor. [22]
Table 10-4. Liquid Fuel Tax Base
ENERGY EQUIVALENCY as Battery Charge Capacity REQUIRED TO PERFORM WORK
incl. LOCAL ENERGY STORAGE EFFICIENCY (losses) in kWh’s,
by Fuel Type, By County
(Reference: Section 3. Table 4)
Table 10-5 shows the estimated power generation capacity needed to perform the work shown in Table 10-4. This value is calculated by deriving a reasonable estimated efficiency quotient that factors in transmission and delivery losses plus assumed drivetrain losses while performing the work.
Table 10-5. Liquid Fuel Tax Base
ENERGY EQUIVALENCY as GENERATION CAPACITY REQUIRED
including STORAGE GENERATION in kWh’s, by Fuel Type, By County
(Reference: Section 3. Table 4)
This approach yielded electrical power generation estimates[23] which correlate with the data published by Hawaiʻi’s Department of Business, Economic Development and Tourism (DBEDT)[24].
5.4 Bottom-Up Analysis – Distance Traveled/Fuel Efficiency/by Vehicle Classification
As defined in Section 5.2.5, the Bottom-Up analytical approach was conducted for “Road Transport” only[25]. This analysis was performed using data provided by the Hawaiʻi Department of Transportation (HDOT), Hawaiʻi’s Department of Business, Economic Development and Tourism (DBEDT), the US Dept. of Energy (USDOE) and the Federal Highway Administration (FHWA). This analysis uses publicly reported vehicle registrations and assumes reasonable fuel efficiencies measured as distance traveled (mi/km) divided by volumetric consumption for that distance (gallons/liters) and applied to standardized vehicle classifications.
This approach forms a second basis upon which the power generation capacity that would have been needed to perform the same amount of work during the reference year, 2019, can be estimated.
Tables 11 and 12 show the number of motor vehicles registered for road use in the State of Hawaiʻi and further detailed by county and tax status in 2019. Figure 44 illustrates the Hawaiian fleet proportionally by fuel type.
Vehicle classifications are illustrated in Figure 45 (FHWA[26], 2013). Hawaiʻi’s 2019 Liquid Fuel Tax Base is shown in Tables 4 and 5 (Section 3.3) and broken down by County.
Fuel efficiency is shown as the volume of a liquid fuel (gallon/liter) per conventional distance metrics (mi/km) (Table 16) and by kWh for electric vehicles broken out by the same distance metrics as kWh consumed per mi/km (Table 17). The statistics in these tables represent a broad spectrum of vehicle types (HDOT vs. FHWA classifications)[27].
Vehicles using liquid fuels and listed within each body type are known to use either gasoline, ethanol blended gasoline (E-10), diesel fuel or biodiesel, LGP or other liquid fuel type.
5.4.1 Bottom-Up Analysis – Demonstrates the Criticality of Purpose Driven Data
The Bottom-Up analysis uses two distinct calculation models to estimate the power generation needed for ground transportation in Hawaiʻi. They are categorized by fuel type: Gasoline powered, and Diesel powered.
1. Analyzing Gasoline powered vehicles within passenger and freight sub-categories (Tables 19 and 20) using published fuel efficiency data as shown in Table 16 and assumed milage data shown in Table 18.
2. Analyzing Diesel powered vehicles, with further separation into commercial passenger and freight vehicles sub-categorized by FHWA vehicle classifications and using available data as shown in Tables 22 through 27.
Two approaches were deemed appropriate because, in the absence of data that reflects historical vehicle fuel consumption and distances traveled by vehicle type, by use[28]and by island, assumptions needed to be made which were founded upon legacy fueling patterns that will not persist when transportation is largely electrified. For example: EVs won’t be exclusively fueled at fueling stations. They will be charged at home, at work, at public commercial outlets, in parking garages among others.
Figure 43. Hydrogen Transport and Dispensing (Image: Canva)
The adoption of Hydrogen and H2 derivative fueling will require:
1. Significant additional power generation
a. some of which will require firm power generation
b. some of which will be dedicated and site specific
2. Hydrogen production
a. some of which will be shared and non-site specific
b. some of which will be co-located with generation therefore being site specific
3. Hydrogen transport preparation including compression and liquification
4. Local and interisland distribution
5. Specialized fueling systems
6. Specialized safety and operating protocols
7. Updated regulations
8. Specialized workforce supporting these conditions and more
Analyzing consumption by use, especially within commercial applications, is desired when anticipating fueling locations, power generation, grid or microgrid infrastructure planning, hydrogen production[29], and its accompanying infrastructure. There are several sub-optimal variables that purpose-driven data collection could mitigate such as:
1. People who drive variable-efficiency vehicles within the same vehicle class. (i.e. Passenger vehicles: a Toyota Prius Hybrid vs Ford F150 with a V-8 engine). This factor contributes to the misalignment between VMT, and total fuel consumption estimates which, in an electrified transportation context, will impact charging and generation infrastructure planning. A good example is that refueling an ICE vehicle is conducted at “gas station” whereas charging electric vehicles may take place at residences, local commercial outlets, places of employment, etc. Hydrogen refueling adds another dimension of complexity to infrastructure planning.
2. Counties appear to register different categories of motor vehicle body types[30] than is identified by the state. A mechanism for consistency will yield higher quality power and more accurate historical fueling models translating to greater consideration of charging and generation infrastructure planning.
3. VMT for each motor vehicle use, body and fuel type will indicate charging or fueling, in the case of hydrogen.
a. Here, the need for a more granular data set, where the comparison between fuel consumption, VMT and by vehicle class is desired. An analysis of this kind conducted over multiple years would likely yield higher quality trend modeling.
4. The reference link in Table 18 (Assumed Annual Distance by Passenger and Freight Applications) closely aligns with the data shown in DBEDT Databook 2020, Tables 18.06[31], which states “Vans, pickups, and other trucks under 6,500 lb. in personal use, legally classified as passenger vehicles, are included in the totals for trucks”. Due to the scope of uses vehicles within this weight range may be used, fueling patterns and their accompanying infrastructure could be anticipated with data gathered for that purpose.
5. Given the data available, this dual standard approach does allow for an initial assessment of the task Hawaii faces in its goal to phase out the use of fossil fuels within its economy.
Top-Down / Bottom-Up comparison: For the reasons stated above, the calculations presented in the Top-Down Analysis offer a more reliable energy-content equivalent estimate of the electrical power required than is possible using the data available in our present Bottom-Up Analyses.
Neither the Top-Down, nor the Bottom-Up analyses offer the quality of analysis upon which fueling dynamics, power generation needs, or infrastructure planning should be based. They are presented to illustrate and emphasize the need for purpose driven data gathering.
5.4.2 Ground Transportation, 2019 - Fleet Size (By Use, Tax Status, Fuel Type)
The Bottom-Up Analysis is presented for the purpose of illustrating a rudimentary, real-world use approach toward vehicle specific consumption which would likely be better suited to planning an electrified transportation environment than a purely Top-Down approach. Both analytical approaches are relevant to finding consensus between raw energy content and real-world use. Data in the following tables and figures were used to support Bottom-Up Analyses Models 1 and 2.
Table 11. Taxable Registered Vehicles by Type and by County, 2019
(Source: DBEDT Data Warehouse, Registered Vehicles, Taxable, 2019)
Figure 44. Vehicles in Hawaiian transport fleet in 2019
(Source: Hawaiʻi Energy Data DBEDT Data Warehouse)
Table 12. Vehicle Registration by Taxation Status, by County 2019
(Source: DBDET Data Warehouse, Registered Vehicles, Table 18.09, 2020)
5.4.3 Performance Data – By Classification, VMT, Fuel Consumption and Efficiency
As stated in Section 5.2.7, gasoline and diesel fuel represent most of the fuel consumption for road transport with modest contributions from EVs, LPG, biofuel, etc. While good agreement was found between the Top-Down model and the actual fuel consumption reported by the State for gasoline, similar approach was not possible for diesel in the Bottom-Up analysis for the reasons described in Section 5.4.1.
Used in the Bottom-up Analysis are:
1) Figure 45 illustrates the vehicle classifications as specified by the Federal Highway Administration (FHWA 13 Vehicle Category Scheme)
2) Table 13 shows the Daily Vehicle Miles Traveled (DVMT) attributed to each of the vehicle classifications shown in Figure 45 as reported by HDOT (2018-2023). Table 14 shows 2019 DVMT & VMT data, only.
a) Classifications 1 through 3 and classification 5 are assumed to consume gasoline
b) Classification 4 and classifications 6 through 13 are assumed to consume diesel fuel.
3) Table 15 shows total reported Liquid Fuel Consumption by fuel type and registration use category by County.
4) Table 16 shows the estimated liquid fuel efficiency by vehicle type/fuel type as determined by the US DOE Alternative Fuels Data Center.
5) Table 17 shows the assumed electric power efficiency by vehicle type and distance (mi/km).
Figure 45. VEHICLE CLASSIFICATIONS (FHWA 13 Category Scheme)
Source Hawaiʻi Dept of Transportation, Highways Division, Planning Branch, Survey Section
Table 13. State of Hawaiʻi: Daily DISTANCE Traveled By Vehicle Class (2018-2023)
Source: Hawaiʻi Department of Transportation, Highways Division, Planning Branch, Survey Section
Table 14. State of Hawaiʻi: Daily DISTANCE Traveled By Vehicle Class (2019 Reference Case)
Source: Hawaiʻi Department of Transportation, Highways Division, Planning Branch, Survey Section
Table15. LIQUID FUEL CONSUMPTION by County, REGISTERED VEHICLES BY FUEL TYPE by County (2019)
Source: Hawaiʻi Energy Data DBEDT Data Warehouse 2019, DBEDT Databook 2020
Table 16. Average Fuel Economy by Vehicle Type
(Source: Alternative Fuels Data Center – US Department of Energy)
Table 17. Assumed Electric power Efficiency – by Vehicle Type, per mile/kilometer (2023)
5.4.4 Assumptions and Estimations
Table 18 shows assumed annual distances traveled by county. These assumed VMTs are used in the calculations shown by State, by County and fuel type in Table 20.
Table 19 shows fuel efficiency by fuel type[32] within the primary categories of Passenger Vehicles and Light Freight Vehicles. Note: Table 19 shows diesel mpg which is only used in Calculation Model #2.
Table 18. Assumed Annual Distance By Passenger and freight Applications (2019)
Table 19. Assumed Fuel Efficiency - Passenger & Freight Vehicles, (2019)
Source: Alternative Fuels Data Center, USDOE, Energy Efficiency and Renewable Energy
Table 20. Estimated Distance Traveled – Passenger & light Freight Vehicles (2019)
Assumed Annual Distance Traveled by Vehicle Type (From Table 18)
5.4.5 Bottom-Up Calculation – Model 1 – Non-Diesel Fuel
Table 21. Estimated Electricity Required to Replace Liquid Fossil Fuels
Non-diesel Passenger & light Freight Vehicles ONLY (2019)
Assumed Annual Distance Traveled by Vehicle Type (From Table 18)
Table 22 shows estimated power consumed as an equivalent, converted from liquid fuels to kWh.
It was observed that overall consumption spanning the 4-year period beginning in 2019, before COVID, through 2023, or post COVD, showed significant shifts in consumption by vehicle type as shown in the “4 Year Trend” column in Table 22. However, this was noted without a proportional shift in registered vehicle numbers by class. Data gathering protocols that more closely correlate annual VMT, registered vehicles by type, use and fuel type may provide the basis for planning models that consider the different fueling scenarios the state will encounter as it expands the electrification of its ground and interisland transportation systems. Clarifying the methodology used to gather VMT is essential to determining the level of its accuracy.
Table 22. Estimated Electricity Required to Replace Liquid Fossil Fuels
and Vehicle Distance Traveled (4 Year Trend Comparison)
Assumed Annual Distance Traveled by Vehicle Class from Table 14
Assumed Fuel Efficiency from Table 16
(Electricity indicated is delivered vs. generated)
5.4.6 Bottom-Up Calculation – Model 2 – Diesel Fuel
As stated in Section 5.2.6, a Bottom-Up analysis of diesel vehicles was not possible due to an absence of data that reflects historical vehicle fuel consumption and distances traveled by vehicle type.
Therefore, we have estimated numbers to correspond to these criteria using:
1. registration by fuel type
2. mileage by vehicle class
3. estimated fuel efficiency data
Data Point 1: We know the number of registered diesel vehicles statewide which we assume to be commercial freight vehicles of differing classes. This is shown in Table 22. (Source: DBEDT Data Warehouse, Energy, Taxable Registered Vehicles)[33]
Table 23. Registered Vehicles – Taxable, 2019
Source: DBEDT Data Warehouse, Energy, Taxable Registered Vehicles. (Tab: Master Data Set: A:13-21)
Data Point 2: We also know the VMT by class as reported by the Hawaii Dept. of Transportation. This is shown in Table 23. For clarity, a proportional split between classes 5 through 7 and classes 8 through 13 highlighted has been calculated to serve as a metric for defining fuel consumption and electric equivalencies by class (Tables 24 and 25).
Table 24. Miles traveled by diesel Freight vehicles 2018-2023 - Statewide
Table 25. Miles traveled by diesel Freight vehicles in 2019 (% of Statewide)
Data Point 3: We have estimated efficiency data from the US Dept. of Energy, Energy Efficiency and Renewable Energy center (Table 19) and assumed electrical efficiency data (Table 17)
Table 26. Estimated Power Generation Capacity Required for Class 4 Transit Buses – 2019
(Fuel assumed to be diesel)
Tables 27 and 28 show an estimated power generation requirement for diesel powered vehicles by class and by county based on a proportional distribution of registered vehicles and an assumed uniform DVMT across all counties. It is relevant to anticipate the energy consumption by vehicle class since the generation, production, and distribution of energy to vehicles on each island will differ from those models today. Data with higher specificity will aid in planning the unique refueling requirements on each island.
Table 27. Estimated Power Generation Capacity Required for Class 5-7 Freight Trucks Buses – 2019
(Fuel assumed to be diesel)
Table 28. Estimated Power Generation Capacity Required for Class 8-13 Gasoline Trucks Buses – 2019
(Fuel assumed to be diesel)
5.4.7 Conclusions on Analytical Processes – Furthering Electrification
Electrifying the Hawaiian economy cannot be an extension of the status quo. It requires planning outside our historical norms. This type of planning requires purpose driven data gathering that captures use models in addition to fuel consumption volumes and vehicle registration statistics. How the economy operates needs to be modeled in the context of modernized energy production and consumption. Vehicle fueling dynamics will significantly change. For example: EVs vs. ICE vehicles. EVs won’t be exclusively fueled at fueling stations. They will be charged at home, at work, at public commercial outlets, in parking garages among others.
The adoption of Hydrogen derivative fueling will require additional power generation, hydrogen production, transport preparation including compression and liquification, local and interisland distribution, specialized dispensing systems, specialized safety protocols, updated regulations and a specialized workforce supporting these conditions and more.
Figure 46. Honolulu Port Operations (Image: Canva)
This is a current, real-world scenario illustrating transition challenges as of October 2024:
HDOT AWARDED $59.2 MILLION BY EPA CLEAN PORTS PROGRAM (HDOT, 10-30-24)
HONOLULU – The Hawaiʻi Department of Transportation (HDOT) will receive $59.2 million from the U.S. Environmental Protection Agency (EPA) Clean Ports Program to support the state’s ongoing climate adaptation and air quality planning efforts.
HDOT received an award of $2.5 million to complete an air emissions inventory baseline study for ocean going vessels, harbor craft and cargo handling equipment that operate in any of the state’s nine commercial ports. The study, which is 100% federally funded, will also include recommendations for emissions reduction targets and strategies to reach the targets. This baseline will serve as the benchmark against which HDOT will measure progress in future years.
HDOT received a second award of $56.7 million to purchase hydrogen-fueled tractors for use in the Sand Island Container Terminal. The grant will also fund the construction of a hydrogen fueling facility in Honolulu Harbor. HDOT looks forward to working with its maritime partners on this project.
The current deployment plan does not have a local resource for renewable hydrogen production. There is, however, discussion surrounding its production by Hawaiʻi Gas (Hawaii Gas, Hydrogen) from a petroleum by product called naphtha[34] and deriving H2 (either grey or blue H2) via steam reforming/carbon capture, already an ongoing part of their existing Synthetic Natural Gas (SNG) process. Cost for hydrogen delivered to the port is currently unknown.
The economics associated with this process or the construction of a separate hydrogen fueling facility in Honolulu Harbor are unknown at this time. Estimates for the volume of H2 needed to operate this fleet of H2 fueled tractors are approximately 2 metric tonnes per day. If that volume of H2 were to be produced electrolytically, the power requirement would be a dedicated installed capacity of approximately 5MW (assuming 60kWh per kg; 2,000 kg * 60kWh/24)
A transition to hydrogen powered port vehicles is likely to extend beyond the ports placing greater emphasis on power generation, grid design, business support and public acceptance. One thing for certain; Hawaiʻi will need to navigate the design and deployment of a wholly new energy paradigm in parallel with the legacy paradigm as the latter is phased out by the former.
5.5 Hawaiian Domestic Maritime Activity
The Hawaiian maritime industry was mapped (Section 41, Appendix P: Maritime Activity in Hawaiʻi).
Table 29. Hawaiian maritime vessel registration, Dec 31, 2021
The global maritime transport shipping fleet delivers a vital service to the world’s industrial ecosystem. The volume of cargo moved is truly vast and the distances travelled are greater than those by any land-based transport system in use. Therefore, the intercontinental movement of goods and commodities cannot happen at the scale needed without transoceanic shipping.
As raw materials are typically extracted on one continent (for example Africa, Middle East, South America, South Africa, etc.), used in manufacturing on another continent (for example China in Asia), and then moved, used and consumed on yet other continents (for example Europe, North America, etc.). These material flows are so large that it will be a significant challenge to phase out the use of fossil fuels in the maritime industry.
Multiple options to phase out fossil fuels have been proposed (EFTE 2018), ranging from fully EV, to Hydrogen, to fuel cell or ICE, to other Liquid Organic Hydrogen Carriers (LOHCs) such as methanol or ammonia, to biofuels, to sail assisted and nuclear propulsion (currently used in large military vessels like aircraft carriers).
However, Maritime shipping in Hawai’i is very different that what is found elsewhere around the world due to the Jones Act which limits how seafaring cargo is transported between US Ports of Discharge. Although it has been revised, amended, or altered dozens of times since its enactment in 1920, the basic structure of the Jones Act remains relatively intact.
The law only applies to the movement of domestic cargo, not international cargo. With respect to merchandise, the law requires that when transported on vessels between two points in the United States, merchandise moves on vessels that are built in the United States, registered in the United States, crewed by Americans, and owned by US citizens. And while the basic contours of the law are relatively simple, the applications and nuances of it are far less so. Over the course of 100 years, a body of amendments, provisos, regulations, interpretations, caselaw, policy, and practice have helped shape its application. For the purposes of this report, we will limit the analysis of maritime energy consumption to the scope of vessels described in Table 18, herein after referred to as ‘Small Boats’.
Table 30. Hawaiian domestic maritime fuel consumption
(Source: Compiled by Research & Economic Analysis Division,
State of Hawaiʻi Department of Business, Economic Development and Tourism.)
Figure 47. Hawaiian domestic maritime fuel consumption in years 2006 to 2021
(Source: Compiled by Research & Economic Analysis Division, State of Hawaiʻi Department of Business, Economic Development and Tourism
Figure 48. Hawaiian domestic maritime fuel consumption in years 2007, 2019 and 2021
(Source: Research & Economic Analysis Division,
State of Hawaiʻi Department of Business, Economic Development and Tourism)
5.6 Aviation
The Hawaiian aviation industry was mapped (Section 42, Appendix Q: Aviation in Hawaiʻi).
Table 31: Domestic aviation fuel in Hawaiʻi (2007,2019, 2023)
(Source: Research & Economic Analysis Division,
State of Hawaiʻi Department of Business, Economic Development and Tourism.
Table 32. Aviation in Hawaiʻi, Passengers, cargo, mail, international and inter island domestic
(Source: Hawaiʻi State Department of Business, Economic, Development & Tourism and
U.S. Department of Transportation, Bureau of Transportation Statistics , 18.39
https://www.transtats.bts.gov/DL_SelectFields.aspx? )
6. What is a Scenario?
Why are they here and what is their purpose? To phase out the use of fossil fuels, replacements will require the generation and transformation of electricity into ‘energy carriers’[35] that will be designed to perform the same functions as currently performed by fossil fuels, and by petroleum, in particular. This can also be expressed as “electrifying the global economy”.
For the purposes of this report, scenarios H0 through HH reasonably assess the amount of power generation needed to completely phase out fossil fuel in Hawai’i by a.) end use and, b.) means of power generation. This will allow users of this report to calculate the delta between what is needed, what is possible given the specifics of particular geographical location in Hawaiʻi and its relative, available resources. From there, various hybrid scenarios can be developed combining specific courses of action which will, in turn, allow for economic, environmental, social, scalability and sustainability factors to be included in the public policy, public-private investment, and physical deployment decision-making processes.
Figure 49. Scenarios for possible future development in the State of Hawaiʻi
7. Scenario H0: No action is taken.
Scenario H0 (Hawaiʻi Scenario 0) is based on the concept that no further industrial reform to phase out fossil fuels is undertaken, and that the Hawaiian economy continued on its current trajectory.
Currently, Hawaiʻi is highly dependent on fossil fuels for its energy needs, with oil and petroleum products making up the majority of its energy consumption. The transport fleet (vehicle, truck, bus, aircraft, and maritime activity is primarily fueled with petroleum products (Figure 35, Sec 5.6.1). In 2020 oil fueled 67.73% of electrical power generation (Figure 29 and Section 37, Appendix L). The use of coal was eliminated in 2022.
The Hawaiian economy is dominated by the tourism industry, its associated support services, and US military operations (Section 28, Appendix C). Most of these are wholly dependent on petroleum products to operate. The aviation (Section 42, Appendix Q). and maritime (Section 41, Appendix P) industries are wholly dependent on petroleum based liquid fuels.
Of the food that Hawaiʻi consumes, 84.3% is imported either by maritime or air freight. (Appendix C). The food that is produced in Hawaiʻi is also wholly dependent on petroleum products (Figure 40). For every calorie of food that is produced in the United States, 10 calories of fossil fuel energy are put into the system to grow that food in terms of production, storage, and transport (Green 1978, Canning et al. 2017). Figure 36 shows how this happens.
The following graphic illustrates a ‘systems modeling’ approach toward understanding the farming industrial production, processing and distribution processes. The words in red show the portions that depend on fossil fuels either directly (consumption of diesel fuel) or indirectly (consumption of electricity generated from fossil fuels). The vast majority of goods Hawaiʻi consumes on an annual basis is imported by maritime shipping (Appendices C, D and P), all of which depends on petroleum derived fuels.
Figure 50. Industrial agriculture farming modelled as a system
(Image: Simon Michaux)
Oil is not only the primary raw material for producing fuels and lubricants, but it also serves as the hydrocarbon source for the production of most organic polymers (plastic materials), pharmaceuticals, dyes, and textiles (see Figure 51). Oil, along with container ships, trucks, aircraft and information technology, form the backbone of our modern day, globalized, wired together, industrial ecosystem. Arguably, it may be the single most important raw material in the world.
Figure 51. Modern Products Made From Oil (Source: Rig Source)
7.1 Petroleum, Primary Energy and GDP
The implications of Figure 52 below are quite significant. It shows a strong correlation between Global Domestic Product (GDP) and global Total Liquids Consumption [36]. This metric includes a variety of liquid hydrocarbons and blends used in transportation, heating, power generation, and other applications. Today approximately 90% of all industrially manufactured products depend on the availability of petroleum.
Both figures 52 and 53 illustrate a significant pattern. One widely used metric to indicate success in the current economic marketplace is Gross Domestic Product (GDP), where an increasing GDP value is the desired, even required outcome. Figure 42 places different national economy’s GDP value against their corresponding total consumption of liquid fuels.
Figure 52. We are petroleum driven global society
(Source: Developed from previous work;
Labyrinth Consulting Services, Inc., Art Berman;
BP Statistics 2022; Our World in Data)
What we see is that smaller GDP values correlate with lower volumes of liquid fuel consumption and a larger GDP value corresponds with higher consumption. Despite all our efforts over the last few decades, the Global Economy is still an oil-based economy.
Figure 43 shows that the correlation variance between GDP and total energy consumption was less than 3% spanning the 63-year period spanning the years 1960 through 2022.
It should be noted that the negative moving deviations later in the correlation anaysis correspond to the impacts surrounding a global financial crisis (2009) and a global pandemic (2020). Prior to these events the correlation variance was less than 1%. (Source: BP Statistical Review, 2015, World Bank, 2015, Jancovici, 2011)
Figure 53. World GDP in 2023,
Seasonally adjusted US Dollars (vertical axis) plotted against the world energy consumption
from 1960 to 2022 (horizontal axis)
7.2 Petroleum and the Global Economy
The international division of labor, to which many countries owe their wealth, would not be possible without today’s cost-efficient petroleum powered transport systems. This is what powers the global supply chain.
Figures 54 (Pacific maritime traffic) and 55 (global maritime traffic) show recent, real-time snapshots of the global economy being transported across the world’s oceans. The icons shown in each represent individual ships. Green indicates cargo ships. Red indicates oil tankers.
Figure 54. Pacific Maritime Traffic– Cargo & Tanker only (Live Screengrab Sept 2024)
(Source: Marine Traffic - marinetraffic.com)
Figure 55. Global Maritime Traffic – Cargo & Tanker only (Live Screengrab Sept 2024)
(Source: Marine Traffic - marinetraffic.com)
Oil-based mobility significantly influences our lifestyle, both regionally and locally. For example, the ability to live in suburbs, away from centralized workplaces would be impossible for many people without personal transportation. To a certain extent, the classical suburb owes its existence to cheap, abundant oil.
The availability of cheap, abundant oil impacts all aspects of our economic and social systems. A long-term increase in the price of oil would pose a broad, systemic risk. For subsystems ranging from worldwide goods shipping to personal transportation, oil’s criticality is obvious.
The international community has a vital interest in secure oil supplies. Its significance is reflected in many state and international organizations’ strategic planning documents. Any long-term shortfall in supply relative to demand would create an overall systemic risk because petroleum’s integral role as a source of energy and chemical raw material would impact every socio-economic subsystem.
It is a fact, however, that oil is finite. If there were a peak and subsequent decline in oil production flow rates, the question becomes when that might occur and to what degree a post-peak rate of contraction might be.
A further question exists: Is this eventuality something that warrants preemptive planning? There is a discussion of the structural challenges both the oil industry and the world at large will have to face in the coming years. (Section 43, Appendix R: Oil Outlook)
7.3 Are Future Oil Supplies Assured? – The Criticality of the Daily Flow Rate
Oil markets are global. Oil consumption is measured in barrels-per-day (bpd). Oil demand is measured in dollars-per-barrel. It is a finely tuned balancing act to keep both the market and producers satisfied. No single nation controls how much oil flows from one day to the next.
As shown in this section, the status of the oil market is of strategic and possibly existential importance to the stability of the liquid fossil fuel centric, industrial system upon which the Hawaiian economy depends.
Figure 56 shows world liquids production across 10 years. There was a localized peak in global production in November 2018, followed by a demand reduction due to the Covid-19 Pandemic quarantines a year later (the sharp dip shown in Figure 56). There was a strong recovery after the 2020 dip, where total world liquids production looked like it might surpass the 2018 peak. However, that never materialized.
Figure 56. Gasoline is now being produced from biofuels, natural gas liquids and crude oil
(Source: Labyrinth Consulting Services, Inc., Art Berman, EIA)
Note: World Liquids: Now includes biofuels, liquids produced at natural gas processing plants. Crude oil is refined to produce a wide array of petroleum products, including heating oils; gasoline, diesel, and jet fuels; lubricants; asphalt; ethane, propane, and butane; and many other products used for their energy or chemical content.
Looking at what made up the world’s liquid fuels’ production shows a relevant pattern (Figure 56). While total liquids as a conglomerate is recovering from Covid 19 pandemic supply disruptions lows (in 2020), crude oil and associated condensates are declining. The lighter density fuels like gasoline are now being produced in a much greater overall proportion using biofuels and liquids produced at natural gas processing plants. It is important to note that diesel fuel can only be produced using heavier crude and condensate. This directly impacts industrial mobility.
This could mean two things:
1. Peak Oil may be in our past
2. What Peak Oil means now must evolve. ICE technology (Internal Combustion Engine) now uses fuel sourced from not just oil, but biofuels and products redrived from the gas industry. Peak Oil for just crude no longer describes a market shortfall for all ICE fuels.
The production of diesel fuel, marine bunker fuel and asphalt all depend on sources of heavy crude oil, which is now declining. Figure 57 shows a study projecting future production of Total World Liquids. The production of crude oil may increase a little but never exceeds the November 2018 volumes and declines from there.
Figure 57. total world liquids production expected to peak around 2027
(Source: Labyrinth Consulting Services, Inc., Art Berman, EIA)
The gasoline produced from natural gas liquids was projected to increase a small amount. Total world liquids have been projected to peak in 2027. This is only 3 years away. If this comes to pass, then total peak petroleum products and their substitutes will peak in only a few years’ time. The problem with this is the projected time period required to phase out oil technology and infrastructure is a qualified [37] 20 years (Hirsch 2005 and 2010).
Scenario H0 (in conjunction with Section 43, Appendix R: Oil Outlook) suggests that the Hawaiian economy is extraordinarily vulnerable to structural instability within the global oil market. It is therefore recommended that Hawaiian leadership considers taking measures to make Hawaiʻi more resilient to these challenges by developing post-fossil fuel energy generation and economic capabilities that do not wholly depend on oil, or petroleum products.
_____________________________________
The scenarios that follow are intended to illustrate estimates of what quantity of electric power generation may have been required to perform the equivalent amount of work as compared to what was performed during 2019.
It’s important to remember that adopting any of these scenarios, in any mix or combination, will require additional energy inputs, as the work necessary to build the expanded generation, connective or distribution infrastructure to support them are not and were not part of Hawaiʻi’s economic activity.
Therefore, the figures that follow should be regarded as very conservative estimates relative to what will be required.
_____________________________________
8 Scenario HA: All systems are electrified, All ICE transport is EV
Scenario HA was based on the full electrification of the whole Hawaiian industrial system. The foundation for this simulation is based on Hawaiʻi’s energy consumption reported during 2019.
· All Hawaiian Internal Combustion Engine (ICE) vehicles will now be substituted with Electric Vehicles (EV).
· All Hawaiian power generation capacity are wind turbines and solar panels. As wind and solar power is highly intermittent,
· A stationary power storage buffer is constructed using a battery bank (See Appendix S). A hydrogen fuel power storage option will also be examined.
In Section 5, both Top-Down and Bottom-Up analyses were conducted to estimate the size and character of the Hawaiian transport fleet. In scenario HA, this transport fleet was to be completely electrified. To do this, the Top-Down analysis was selected as there was missing data to effectively use the Bottom-Up analysis (see Section 5.XX). The quantity of each transport fuel type consumed in the state of Hawaiʻi during 2019 was mapped out in Section 5. Using values shown in Table 33, the thermal energy content in BTUs (British thermal units) was converted to kWh, (Table 34-1).
Table 33. Fossil fuel energy content (Source: US Department of Energy 2024b, EIA 2024c)
Table 34-1. Quantity of fossil fuels consumed in 2019 for the Hawaiian transport fleet
Figure 58 shows the analytical calculation path as was conducted in Hawaiʻi, by renewable energy analyst (Needham 2024).
Figure 58. Electrification of the ICE transport fleet calculation flow chart
Then the energy transfer efficiency of the internal combustion engine (ICE) for each vehicle class was used to determine the useful physical mechanical work done (Table 34-2). Most internal combustion engines have an efficiency ranging from 21% to 40% depending on the technology application.
To determine the needed power draw for an EV to travel a given distance, the efficiency of the electric system to translate power stored in the battery to physically moving the vehicle (Ehsani et al. 2018). The overall energy efficiency of an electric vehicle is estimated as 73%, comparing energy stored in the battery and the wheels turning (Malins 2017). This is far more efficient than any of the ICE technologies. The sources of lost energy in the system are listed below:
· Energy storage and distribution in battery: Approximately 5% energy losses
· Inversion AC/DC: Approximately 5% energy losses
· Battery Charge efficiency: Approximately 5% energy losses
· Inversion DC/AC: Approximately 5% energy losses
· Engine efficiency: Approximately 10% energy losses
This depends on a number of real-world factors. Battery technology is evolving quickly. and the following is often dependent on a systems’ age. So, if the useful mechanical work done during the assessment period was performed by an electric vehicle system (EV), the amount of electrical power required to be delivered by the battery system was estimated based on generation and charging loss factors and is shown in Table 34-2.
Table 34-2. Estimation of mechanical work done by fossil fuels in 2019 Hawaiian transport,
and an estimation of an EV equivalent
All vehicle classes were summed together estimating the demand load for the State’s generation capacity and power grid sufficient to charge a Hawaiian BEV transport fleet for one year (based on 2019 transport reported numbers by DBEDT and HDOT).
Table 34 -3 shows this estimated total generation capacity including an assumed transmission and delivery efficiency of 91.2% between the points of generation and of consumption (Needham 2024).
Table 34-3. Estimation of the annual power generation required to electrify the 2019 Hawaiian transport fleet
8.1 The electrification of the aviation industry in Hawaiʻi
There is a school of thought that has been actively pursued in many strategic plans around the world to decarbonize the commercial long-haul aviation industry. One such option which is being taken seriously and is being researched is the electrification of aviation. In other words, it is the removal of the petroleum fueled jet engine and replacing it with an electric propulsion system powered by a battery storage system carried on board the aircraft. There are many engineering difficulties which would have to be overcome to make this feasible. Thus far, electrically powered aircraft have had comparatively small passenger capacity and have been limited to short range travel. It’s difficult to envision a large Airbus passenger aircraft that is able to fly from Honolulu to Los Angeles on battery power. Of course, there is the belief that technical innovation will engineer a solution. In the meanwhile, it is feasible that Hawaiian interisland travel could be commercialized using BEV aircraft.
Table 27 calculates the electrical power required for fully electric Hawaiian aviation industry, based upon the aviation fuel consumed in the year 2019. To achieve this target, 11 787 GWh of electricity would have to be generated annually.
Table 35. Estimation of the electrical power generation for an electrified Hawaiian aviation industry Scenario HA
8.2 Electricity demand in Scenario HA
Electrical power sold in Hawaiʻi in the calendar year 2019 was 9 201 GWh (Table 5 and Appendix M). Most of this electrical power was generated with existing fossil fuel systems (oil products are exclusively used as the fuel source). If this power was now to be generated with non-fossil fuel systems, an estimation of storage and transmission efficiency would have to be conducted in the same way as the transport system.[38]
Table 36 and Figure 59 shows a summary of the data taken from Tables 26 -3 and 28. Total annual electrical power demand for Scenario HA, was 31 205 GWh.
Table 36. Annual electrical power demand Scenario HA (based on the 2019 Hawaiian scope of physical work)
Figure 59. Estimated annual electrical power requirements for Scenario HA
8.3 Size of the Hawaiian EV transport fleet
The size of the Hawaiian electric vehicle transport fleet was estimated. Each class of vehicle shown in Table 14, Section 5.4.3, was allocated an average electrical power consumption value based on a publicly available electric vehicle performance data (Table 37, below).
Table 37. Estimated Power Efficiency (kWh) By Vehicle Type in 2019
Table T1 in Appendix T provides a list of current electric vehicles (EV), with battery size, efficiency, average range, and a range of ranges in the city, and out on the open freeway. Range estimates consider efficiencies that span driving in sub-zero temperatures with heating on to driving in hot weather with no air conditioning. All vehicles can achieve longer ranges if driven economically.
Table T1 in Appendix T also shows a range of EVs, that on average a passenger car consumes 0.35 kWh/mile (0.22 kWh/km), or for every mile travelled, the vehicle needs 0.35 kWh.
Table T3 in Appendix T shows the specifications of a series of electric commercial vans. These vehicles are in production and specifications are readily available. An average energy consumption for a Light Truck (Trucks Class 5 to 7) vehicle to be used is 0.1.61 kWh/mile (1.0 kWh/km).
Table T4 in Appendix T shows the specifications for a range of Light-Duty vehicles (LDV) or EV pick-up trucks like the Tesla Cybertruck (pickups/vans Class 3). The average energy consumption for a LDV to be used is 0.41 kWh/mile (0.25 kWh/km).
Table T5 in Appendix T shows the specifications of EV buses. Only two examples are shown there (7900 Volvo and BYD K9), but these two models represent a large proportion of the current global EV bus fleet. Table T5 in Appendix T also shows an average energy consumption for a Transit Bus, Paratransit Shuttle, or School Bus EV vehicle to be used is 2.14 kWh/mile (1.33 kWh/km).
Table T6 in Appendix T shows the specifications for Heavy Commercial Vehicles (HCV) Class 8 trucks if they were EV systems with average energy consumption of 2.38 kWh/mile (1.48 kWh/km). Specifications are from manufacturer’s press releases.
Table 38 shows the number of vehicles by class (Table 37) with an estimated battery capacity needed to power an EV vehicle fleet in the State of Hawaiʻi. The total size of electric vehicle battery capacity required for these vehicles is estimated to be 62.4 GWh.
Table 38. Size of the Hawaiian EV fleet
8.4 EV charging supporting infrastructure
The number of charging stations and supporting infrastructure that would be needed in the state of Hawaiʻi to service a fully electrified transport fleet was estimated. The National Renewable Energy Laboratory (NREL) did a study (Wood et al. 2023), where it was calculated that 28 million charging ports would be required to service an electric vehicle fleet size of 33 million cars which represents the study’s target for 2030. For a mid-adoption scenario of 33 million PEVs, a United States national network of 28 million ports could consist of:
· 26.8 million privately accessible Level 1 and Level 2 charging ports located at single-family homes, multifamily properties, and workplaces
· 182 000 publicly accessible fast charging ports along highway corridors and in local communities
· 1 million publicly accessible Level 2 charging ports primarily located near homes and workplaces (including in high-density neighborhoods, at office buildings, and at retail outlets).
Figure 60. EV Charging Stations (Image: Canva)
Assuming this same ratio between Electric Vehicles and charging ports, and that Hawaiʻi would have an EV fleet of 1.31 million vehicles, then 1 308 344 charging stations would be needed across the State of Hawaiʻi, in the following proportions:
· 1.25 million privately accessible Level 1 and Level 2 charging ports located at single-family homes, multi-family properties, and workplaces.
· 8 510 publicly accessible fast charging ports along highway corridors and in local communities
· 46 757 publicly accessible Level 2 charging ports primarily located near homes and workplaces (including in high-density neighborhoods, at office buildings, and at retail outlets).
8.5 Scenario HA, Exclusive solar power electricity generation
Scenario HA requires 31 205 GWh (Table 36) of electrical power to be supplied annually.
Figure 61. Utility Scale Solar Farm (Image: Canva)
What installed capacity[39] would be required if solar panels supplied 100% of the electrical power needed? A calculation was done to estimate the size and performance of a solar panel power grid across the state of Hawaiʻi, where solar panels were installed in as many places as possible in urban areas. Figure 62 shows a calculation step flow chart.
Areas where solar panels could be installed, included single family rental residential buildings, commercial rooftops, parking spaces, and undeveloped areas that could field ground mount systems. Those ground mount systems included fixed tilt units and single axis tracker units.
Then, the estimated number, type, and install DC wattage of solar photovoltaic units was calculated for each area. This all summed together produced the total installed capacity of 18.57 GW (Table 15), for the proposed state of Hawaiʻi solar PV power grid. If this installed capacity was delivered with 450-Watt panel solar panels, approximately 41.2 million panels would need to be in operation throughout the State of Hawaiʻi.
Using reported data on solar radiance on the island of Oahu, a study was done (Needham 2024) where the monthly specific yield for each kind of solar PV unit was calculated. This in turn was used to calculate the electricity generated per month, For 12 months by each type of solar PV unit in each type of installation. All 12 months of electricity production were all summed together to estimate the total annual power delivered by this proposed grid (31.20 TWh).
Figure 62. Size and performance metrics of the proposed Hawaiian solar PV grid calculation flow chart
Tables 39 to 41 show the data outcomes of this analysis.
Table 39. Breakdown of performance metrics for different types of PV installations
in the proposed Hawaiian solar power grid in Scenario HA
Table 40. Monthly Specific Yield Data by PV Type in Hawaiʻi in the proposed Hawaiian solar power grid
Table 41. Estimated electrical power delivered by month for the proposed Hawaiian solar power grid in Scenario HA
Figure 63 shows the monthly power produced by the entire grid across a calendar year (12 months), drawn from the data from Table 40, with an average monthly production of 2 600.4 GWh. Figure 63 also shows that the annual production of 31.20 TWh of electricity, does not happen evenly across all months. The winter months produce much less electricity than the summer months. While this is recognized to happen in latitudes close to the polar geographical locations, it was assumed that this would be less extreme close to the equator, in a location like Hawaiʻi.
Figure 63. Estimated electrical power delivered by month for the proposed
Hawaiian solar power grid in Scenario HA
8.6 Scenario HA, Size and capacity required for stationary power storage for wind and solar
Historically, electricity is used immediately after it's generated (within milliseconds). Some non-fossil fuel electrical energy generation systems are intermittent and cannot provide consistent levels of power generation throughout the day. Typical with intermittent systems is that they produce different amounts of energy over time. Sometimes they produce more than is needed at the instant it is produced. Sometimes they produce less.
Existing electrical engineering technology depends on stable (no power outages), consistent and clean (sinusoidal, without power spikes), at a frequency of 50 Hz or 60 Hz in a very narrow specification bandwidth (Grigsby 2006 and Gottlieb 1997). Variations must be corrected within a temporal resolution as short as microseconds.
Any variation in power supply quantity and quality has the potential to destroy sensitive equipment. Without a power buffer the electrical energy grid would be subject to frequent outages and even a full system collapse (Menton 2022 and Grigsby 2006).
If the volume of electrical energy from renewable sources is relatively small, intermittent power generation is a manageable issue. As renewable power becomes a larger share of the power generated, additional infrastructure is needed in the form of energy storage (Friedemann 2021). Therefore, a power buffer or backup in some form becomes a critical sub-system for power systems that rely on larger quantities of intermittent power generation, such as wind and solar.
Wind and solar, in particular, require this type of external buffer to function. It doesn’t matter if one builds wind and/or solar facilities with capacity of ten or one hundred or even one thousand times peak electricity usage (Menton 2022). These systems are highly influenced by changes in the weather, which is known to be volatile. For example, on a calm night, or during days or weeks of deep wind/sun drought, those facilities will produce nothing, or so little power as not to be useful. When it does, only a full back up or buffer large enough to meet peak demand for as long as the weather remains volatile. If this does not happen, that electrical energy grid will fail and shut down.
To protect grid integrity and maintain reliable power delivery, electric buffer systems such as Battery Energy Storage Systems (BESS)are deployed. There are three scales or scenarios of power storage that are used for balancing generation supply and demand load (Schernikau & Smith 2023).
· Short term, in the second/minute range.
· Intermediate term, in the daily peak and low loads.
· Long-term storage surpassing 2 to 12 weeks (Ruhnau & Qvist 2021, Toke 2021)
It’s during times where excess generation takes place that grid management systems will reduce, or curtail, any excess energy the generation system is currently producing that differs from the amount of energy consumers ‘demand’ the grid deliver to them. It’s during this curtailment period that excess energy can be diverted and stored, thus saving it for use at a time when the amount being generated is less than what is needed. A good example of this can be seen at night when solar generation systems are not producing any power at all.
Energy storage is essential when an electrical grid starts relying on large amounts of intermittent generation to meet consumer demand. Numerous energy storage technologies (pumped-storage hydroelectricity, electric battery, flow battery, flywheel energy storage, supercapacitor etc.) are suitable for grid-scale applications, however their fundamental characteristics differ. (Table 42)
Table 42. Technology options for energy storage (Source: J.M.K.C. Donev et al 2018)
Energy economics dictate that storage will always reduce the Energy-Returned on the Energy-Invested (ERoEI) due to the material efficiency of an energy system (Schernikau & Smith 2023). This happens because any storage system adds to overall system complexity and requires further energy transformation to function. During transmission to and from all storage resources, energy is consumed. This is a manifestation of the 2nd law of thermodynamics (Moran et al. 2014).
The intermittent nature of renewable energy can be mitigated with measures like connecting lots of renewable power stations together and optimizing their power delivery through a single system (Droste-Franke 2015). For today’s grid scale solar and wind systems, BESS are typically required to ensure consistent supply to the grid during the long periods of reduced sunlight hours and reduced wind where it is needed, (Mulder 2014).
How to definitively develop and construct an energy storage system large enough to stabilize wind and solar power generation grids for long-term durations is not known. All commercially available technologies examined work quite well at a small scale and for short durations but are not viable when scaled up (Menton 2022).
Today, there is no economically viable storage system capable of achieving ‘Net Zero’ while supporting wind/solar intermittent generation. (Menton 2022, Schernikau & Smith 2023, McKinsey 2021 shows the data to support this).[40] The capacities used in calculations were as follows:
· 6 hours (Larson et al. 2021)
· 48 hours +10% (Steinke et al. 2012)
· 28 days (Droste-Franke 2015)
· 12 weeks (Ruhnau & Qvist 2021)
Table 43 shows the electrical power produced each month by the proposed power grid. On average, the monthly production was 2.60 TWh. So, the contracted delivery of power for this system would be 2.60 TWh a month. For this system to be self-sufficient and reliably deliver a stable quantity of electrical power, a buffer would be needed from a stationary power storage system.
Table 43 also shows the months that produced less than the average, where power would have to be drawn from another source (i.e.: the power buffer), and the months that produced more than the average, that could be used to charge the buffer. Across the year, there was a shortfall of 2.46 TWh (almost 1 month of capacity) over a sustained 5 months. Taking the average number of days in a month (30.4), this would be 28.8 days of power storage, or 2.46 TWh of capacity required in this buffer. Effectively, that quantity of power would need to be stored for five months. This suggests that the 28-day estimate (Droste-Franke 2015) was reasonable. If the estimated install capacity of 18.57 GW (shown in Table 39) were to operate at 100% efficiency, the estimated solar power system availability was calculated for each month. This averaged over the full 12 months produced an estimated solar power system availability for 19.2% in the State of Hawaiʻi (Table 43).
Table 43. Estimated size of the buffer needed for solar power generation,
and solar power system availability in Scenario HA
8.6.1 Battery bank stationary power storage
For the purposes of this study, power buffer storage for the proposed global electricity grid was modelled at four capacities, each backed by a reference. It was assumed that this power buffer was only for the purpose of managing intermittent energy supply for wind turbine and solar energy generation systems.
A good example is Kapolei Energy Storage (KES). KES is located on the Hawaiian island of Oahu (Figure 64). It received approval from the Hawai’i Public Utilities Commission in May 2021. The world’s largest (at the time) stationary power storage battery bank began operations in early 2024 (Lambert 2024), Its purpose was to replace the last coal fired power station in Hawaiʻi, the AES owned and operated Barbers Point Plant.
KES is located on the industrial West side of Oahu and consists of a massive 185MW/565MWh Tesla Megapack system. The 158 Tesla Megapack 2 XL battery units are going to be used for load shifting and fast-frequency response services on the Hawaiʻi Electric grid. Table 44 shows how many such stations would be needed if all new station power capacities were the same as the Kapolei Energy Storage example. The calculation using data from Table 43 of the proposed Hawaiian solar PV grid would need 28.8 days of storage.
Figure 64. Kapolei Energy Storage (KES), 185 MW / 565 MWh battery storage
Kapolei on the island of Oahu (Source: Kapolei Energy Storage)
Table 44 shows the number of stationary power storage stations that would be needed in context of each of the four EMA 2020 buffer capacities referenced above. Appendix S conducts a more complete discussion of this topic.
Table 44. Estimated stationary power storage buffer for a range of capacities in Scenario HA
For the purpose of this report, it was assumed that the 28 day stationary power storage buffer capacity what's most appropriate, given the estimated buffer from Table 43 would have been 28.8 days.
8.6.2 Quantity of metals needed for battery storage and EV transport Scenario HA
The quantity of metal needed to manufacture batteries the scenario HA was calculated. This calculation included an estimation for the electric vehicle fleet, and for an assumed stationary power buffer storage estimated to manage an intermittent supply of electricity from solar panels.
The size of the Hawaiian electric vehicle transport fleet was estimated. Each class of vehicle illustrated in Figure 45 was allocated a battery with an average storage capacity based on commercially available electric vehicles (Table 37). That produced an estimated electric vehicle battery marketplace needing 62.4 GWh of batteries to be in operation across Hawaiʻi (Table 38).
Tables 45 to 47 show market proportion of the different battery chemistries and power storage applications at the capacity options discussed in Section 8.5 and shown in Table 20. Appendix U show some more complete description of how this was calculated.
Table 45 is the estimated market share of different battery chemistries and their metal content.
Table 46 is the estimated tonnage of metal for each of the different power storage battery chemistries by market share, as shown in Appendix U.
Table 47 shows the combined mass of different metals to produce electric vehicle batteries, and stationary power storage batteries to the capacity modelled in Scenario HA.
Table 45. Global market proportions of power storage chemistries in 2040, for a 29-day buffer calculation for
Scenario HA (Source: drawn from IEA 2021, Diouf & Pode 2015)
Table 46. Metal required for 29-day capacity stationary power storage batteries to phase out fossil fuels
Table 47. Total metals required to produce batteries for Scenario HA
Figures 65 and 66 graphically show the quantity of metal required to produce the total amount of batteries for Scenario HA compared to global mining production of metal in 2019 [41] using data from Table 47.
As shown in Figure 62, the quantity of lithium, cobalt, and vanadium needed to produce the batteries for scenario HA far exceed current annual global mining capacity. Global lithium production in 2019, is only 8.6% of the mass of lithium needed for Scenario HA. Global production of cobalt in the same year, his only 49.6% of the mass of cobalt needed for Scenario HA. Global production of vanadium was only 12% of the mass of vanadium needed for Scenario HA. Global production of lanthanum was only 16.3% of the mass of lanthanum needed for Scenario HA. Global production of germanium was only 3.2% of the needed massive germanium the Scenario HA.
Figure 65. Quantity of metal required to produce batteries in Scenario HA compared to global mining
Lithium, Cobalt and Vanadium metal production in 2019
The quantity of copper required is 21.36% of global copper mining capacity (Figure 66). The quantity of nickel required is 40% of global nickel mining capacity.
It is to be remembered that the state of Hawaiʻi represents only 0.018% of the global population and will be in competition for these same resources with every other economy in the world. This suggests that either the capacity for mining production is expanded several orders of magnitude, or the battery market will become so inelastic that it will not be viable at all.
So, Figure 66 shows reported mineral reserves plus estimated mineral resources on land plus estimated undersea mineral resources. This is the summation of mineral reserves, resources, on land and under the sea, in the planetary environment. Even with this extreme summation of conventional and unconventional sources, there was not enough copper, nickel, lithium, cobalt, or vanadium to manufacture even the first generation of renewable technology to replace the existing fossil fuel industrial system.
At some point in time that first generation will require replacement. To replace it, the resources must be available.
Figure 66 also shows the basic concept of the green transition is impractical due to a serious resource shortfall. This means at some point the global supply chain for solar panels, wind turbines, and lithium-ion chemistry batteries will become economically unviable relative to today’s existing marketplace. This makes Scenario HA generationally impractical. Appendix V shows the calculation chain behind Figure 67, and the link to the peer reviewed study where it is published.
Figure 66. Quantity of metal required to produce batteries in Scenario HA compared to global mining
Graphite, Copper and Nickel metal production in 2019
Figure 67 shows the quantity of metal needed to globally phase out fossil fuels. All four power storage buffer needs are compared against the estimated metal content in the planetary environment. This includes estimates for recently notarized highlighted the deep ocean polymetallic nodules.[42] (Hein et al. 2020). This calculation includes:
· electric vehicles and their batteries,
· hydrogen fuel cells,
· new power systems like solar wind nuclear and hydroelectricity, and
· stationary power storage capacity for the global industrial system.
Figure 67. Quantity of metal required to phase out fossil fuels compared to global reported mineral reserves + estimated mineral resources + undersea mineral resources,
using four different power buffer storage capacities (linear scale)
(USGS Mineral Statistics, Hein et al. 2020) (Appendix V)
8.6.3 Hydrogen stationary power storage in Scenario HA
It has been proposed to use hydrogen as a power storage system (Kavadias et al. 2017, Zang et al. 2016, Rivard et al. 2019, Zuttel 2004). The proposed methods of power storage would be electrical power which is generated to produce hydrogen, which is then stored. Later, this hydrogen is used to generate electrical power when it is needed, to balance intermittent supply of electrical power from wind and solar stations. So, an understanding of how much hydrogen would be needed ahead of time is essential. That volume of hydrogen would have to be produced, stored, then converted back to electrical power to be available to the grid and ultimately to the end user when it would be needed. This does not account for losses during storage or infrastructure maintenance, nor does it account for any hydrogen transport. Assumptions in these calculations were as follows:
· Each 1 kg of H2 can produce 19.98 kWh of electricity (Table 41)
· It requires 57.86 kWh (Table 36 in Scenario HB) to produce and compress 1kg of hydrogen for long-term storage in 700-bar [43] rated tanks.
Hydrogen faces practical issues when considered by used as a power storage. The amount of electricity required to produce enough hydrogen to operate as a store of energy is 2.9 times the electrical power that could be delivered from the stored hydrogen once accessed (Table 40).
Table 48. Summary of mass of hydrogen needed, and electrical power capacity to deliver power storage buffer
in Scenario HA
If it requires 57.86 kWh to produce 1 kg of hydrogen (then add 10% to account for transmission loss between powers station and application), and then getting 19.98 kWh of electrical energy in return, then using hydrogen as an energy storage has a round-trip efficiency of 34.5%.
Table 40 also shows that the global electrical power generation system would have to expand as much as 80.5% if hydrogen was used as a power storage buffer. Hydrogen as an energy storage system may well have its place, like so many other renewable energy technologies, but it is unlikely to be scalable to become the primary energy storage system needed to manage wind and solar power generation systems.
8.6.4 Pumped Storage Hydro (PSH)
Currently, pumped storage hydropower (PSH) provides 98% of all the existing electrical energy stored in the world (Mongird et al. 2019, IEA 2021c, U.S. Department of Energy 2020).
PSH is an energy storage method that runs in parallel to a hydropower plant where water is pumped uphill to a reservoir and then at a later date, that water can be run back downhill, through a hydropower station’s turbine where gravity generates more electricity. (Figure 68).
Figure 68. Pumped-Storage Hydropower (Source: United States Department of Energy)
(Copyright License: https://www.energy.gov/about-us/web-policies)
PSH is often used to smooth out fluctuations across the 24-hour demand cycle. For example, during off peak hours (2200 hours to 600 hours) when demand is in a trough, electricity is used to pump water to the upper reservoir. Then during peak demand, that water flows downhill to the lower reservoir, passing through the hydroelectric power generation system. The electricity generated is then supplied to the grid. In doing so, power was generated off-peak and stored for use at high demand a few hours later.
While the volume of electrical energy from renewable sources is relatively small this is a manageable issue, typically by relying on existing fossil fuel powered baseload generation to fill in the gaps when renewable power is insufficient. Once renewable power becomes a larger share of power generation, then infrastructure will be needed to supply a larger share of electrical energy storage. The power storage needed to phase out the use of fossil fuels is much larger than is currently deployed.
The question is asked whether pumped storage could be used as the needed power buffer smooth out the intermittent power supply from wind and solar generation systems in Hawaiʻi. Consider each of the modelled storage capacities shown in Table 44 used as power storage capacities in a pumped hydro power station. The volume of water required to be stored then passed through the turbines was estimated of each capacity. As an average example of a pumped hydro power station, a flow of 100 m3 of water per second through a turbine/generator operating at 90% efficiency in a system with a ‘head’ [44] of 570 m will yield electrical power of 500 MW (Blakers et al. 2021).
This results in a required 360 000 m3 of water per 500 MWh (or 720 m3/MWh) of energy produced. This production rate was applied to the capacities in Table 44, resulting in Table 49-1 and 49-2. The calculations in Table 49-1 and 49-2 are for how much water would have to be collected. It could be assumed that once collected this water could just be recycled from upper and lower reservoirs.
The water gets used just once and is then released back into the water shed. The volume of water required ranges between 5.6% and 1 894% of the 2019 annual freshwater consumption for the state of Hawaiʻi. The infrastructure required to store so much water would be impractical.
Table 49-1. Estimated volume of water required for different capacities
of power buffer storage in pumped hydro station reservoirs (Metric units) for Scenario HA
Table 49-2. Estimated volume of water required for different capacities
of power buffer storage in pumped hydro station reservoirs (Imperial units) Scenario HA
8.6.5 Possible use of Pearl Harbor’s fuel storage for pumped hydro power storage
As previously explained in Section 8.5.4, pumped-storage hydropower (PSH) provides 98% of all the existing electrical energy stored in the world (Mongird et al. 2019, U.S. Department of Energy 2020). PSH is an energy storage method that runs in parallel to a hydropower plant where water is pumped uphill to a reservoir and then at a later date, that water can be run back downhill, through a hydropower station’s turbine where gravity generates more electricity. (Figure 68 and Appendix S, Figure S12).
Developing a PSH facility on the island of Oahu in Hawaiʻi has been proposed. In 1940, the United States Navy decided to construct a large underground fuel depot to store operational fuel reserves and would be safe from an enemy aerial attack (U.S. Navy 2024: About Red Hill). This facility has the capacity to store 250 million gallons (946.3 million liters) stored in 20 underground tanks in caverns.
Figure 69. Red Hill Fuel Storage Tank Configuration
(Source: Hawai'i Business Magazine, May 2016)
Historically, the operation of this site has had multiple challenges in context of community engagement, and the environmental impact of fuel spills.
In January 2014, Tank 5 experienced a release of 27,000 gallons of fuel due to a contractor's error combined with ineffective response and oversight. After that one-time extreme release, the Navy and Defense Logistics Agency intensified modernization of the facility and the monitoring of groundwater and drinking water purity. The Navy continues to work with Environmental Protection Agency (EPA) and Hawaiʻi State Department of Health (DOH) regulators under 2015 & updated 2023 Administrative Orders on Consent (AOC) to improve the facility and protect the environment.
From 2006-2022, DOD invested $260 million in Red Hill for modernization in oversight, technology, operating procedures and protecting the environment. On March 7, 2022, Secretary of Defense Lloyd J. Austin III announced the decision to remove all remaining fuel and permanently close the Red Hill Bulk Fuel Storage Facility. The Department of Defense and Navy are working closely with the Hawaiʻi Department of Health and the U.S. Environmental Protection agency on a safe and expeditious defueling of the facility, followed by permanent closure.
Figure 70. US Navy, Red Hill Fuel Storage Site, Oahu, Hawaiʻi (Photo: Tony Webster)
One proposal regarding the repurposing of this site has been to convert it to a water storage reservoir in a pumped hydroelectricity generation site where sea water would be pumped up from the coastal shoreline using excess power generation from wind and solar systems. Then, when there is a power supply shortfall, that stored seawater would be released to flow downhill back to the sea, through a power generation turbine. If this proposal was feasible, it would resolve a portion of the difficult challenge in phasing out fossil fuel in Hawaiʻi.
The volume of water that could be stored at Red Hill was estimated at a capacity of 250 million gallons (946.3 million liters). Converting units (1 liter = 0.001 Cubic meters) the Red Hill maximum storage capacity is 946 300 m3 (1 237 714 yd3 or 33 418 269 ft3).
The elevation of the Red Hill storage site has been determined to be 104 meters (341 feet) above sea level. The excavated caverns were 30 meters underground (98.4 feet). The tanks would also be an unknown vertical height below this depth. However, for this exercise we can assume a maximum head-height of 74 m for any hydro system operating between this site and the coastline sea level.
As an average example of a typical pumped hydro power station, a flow of 100 m3 of water per second through a turbine/generator operating at 90% efficiency in a system with a head of 570 m (1 870 feet) will yield electrical power of 500 MW (Blakers et al. 2021). This results in a required 360 000 m3 of water per 500 MWh (or 720 m3/MW) of energy produced.
The example above of 720 m3/MW of energy produced was based on a head height difference of 570m, yet the Red Hill facility would have only 74 m or less head height. As such, the electrical power generation at Red Hill would be less effective than the referenced average example. For the purposes of this report, it was assumed that Red Hill would be able to produce electricity at the same efficiency, 720 m3 of water flow per MW of energy produced.
Therefore, at best, the Red Hill storage tanks (946 300 m3 capacity) converted into a Pumped Hydro Storage site would produce 1 314.3 MWh (1.31 GWh) while being drained of its full volume. The estimated quantity of stored power required ranges from 26.2 GWh to 8.8 TWh (Table 20). A site constructed at Red Hill would only deliver a fraction of the needed power storage required.
8.7 Scenario HA, Exclusive wind power electricity generation
Scenario HA requires 31 205 GWh of electrical power supplied annually (Table 36). What installed capacity would be required if wind turbines supplied 100% of the electrical power needed? According to Table 50 (drawn from Table W3 in Appendix W), the average wind turbine array electrical power generation station had an installed capacity of 37.2MW and generated 81.2 GWh in the calendar year 2018. It was assumed for the purpose of this report that all wind turbines installed were a 6.6 MW capacity Siemens Gamesa model 5.X SG 6.6-170 wind turbine (Figure 71, Siemens 2023).
Figure 71. Siemens Gamesa 5X SG 6.6 170 (Source: Siemens Gamesa)
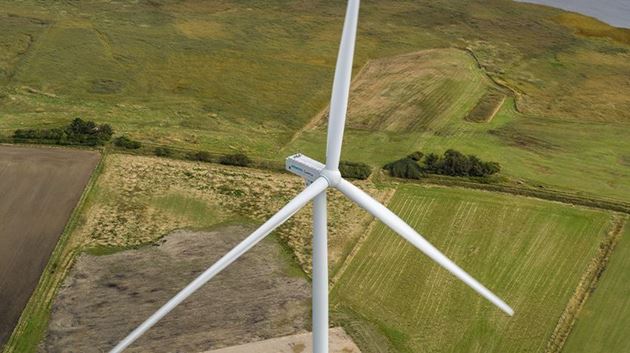
Table 50. Availability and power produced by a globally average sized wind turbine array station in 2018 (Appendix W)
Table 51. Estimated installed wind turbine array power generation capacity for Scenario HA (2019 scope)
Table 51 shows that an estimated 384 average sized wind farms (with 2 165 wind turbines of capacity 6.6MW), with a combined installed capacity of 14.3 GW would have to be operating in the State of Hawaiʻi to deliver the annual electricity for Scenario HA.
Figure 72. Wind turbine spacing in an array (Figure L24, Appendix L)
(Abu-Rub et al 2014) (Image: Tania Michaux)
A 6.6 MW capacity Siemens Gamesa model 5.X SG 6.6-170 wind turbine has a rotor diameter of 557.7 feet (170 m) and a swept area of 244,308 square feet (22,697 m2) (Siemens 2023). As a general guideline, wind turbines cannot be too close together for efficient operation. They need to be 5 to 9 times the rotor diameter apart laterally, and 3 to 5 times the rotor diameter longitudinally (Figure 72).
For the purposes of this report, the wind turbine grid was assumed to be in a square grid, defined by a distance 5 times the rotor length. Therefore, five times that rotor diameter would be 2 788.7 feet (850 m) (5 x 557.7 = 2 788.7) and assuming each 6.6 MW wind turbine is in a large grid (2 788.7 x 2 788.7), then the total area for 2 165 wind turbines would need to operate would be 782.1 km2 (302.0 miles2).
Figure 73 shows that the land area required for wind turbines in Scenario HA the total available land area in the State of Hawaiʻi
Figure 73. Land Area for Wind Turbines Scenario HA, in an 850 x 850m grid (2 789 x 2 789 feet)
8.7.1 Power storage buffer for wind electricity generation
Wind power is much more intermittent in an unpredictable manner (EIA 2015, Huang 2014, Ren et al 2017, Ren et al. 2018 and United Kingdom Parliament 2014). In a wind power generation study, the reliable capacity for electricity delivery to the grid as a percentage of the maximum installed capacity was found to be 7-25% (UK Parliament 2014). Due to a number of large storms during the time of this enquiry, the prediction of the quantity and timing of wind power generation was very difficult to forecast due to the erratic nature of the weather.
Wind has an upper limit of power generation, called the Betz limit.[45] This is where a maximum of 59.3% of kinetic energy in the air is captured by the turbine blade. Most modern turbines do not exceed 45% energy conversion efficiency (Schernikau & Smith 2023). When first installed, modern turbines have an energy conversion efficiency between 35 to 45 %, which then degrades with use (Abu-Rub et al. 2014).
Figure 74. United Kingdom Metered Wind UK metered wind output from 1st September to 13th November 2015
(Source: Mearns 2015 Nov 17)
Figure 74 shows electrical energy generated in the United Kingdom in September, October, and November 2015 (Mearns 2015 Nov 17). Note the many peaks and troughs of power generation. Consider what would be required to stabilize this power system to deliver constant and steady electricity.
The thin vertical red line captioned in Figure 74 represents a 6 hour electrical power storage buffer. As can be observed, this will not be enough to provide a sufficient energy storage buffer to smooth the power generated into a flat line.
Figure 75 shows the power produced with wind generation in the Texas ERCOT grid in 2021 (Texas Comptroller 2022), where a 13-day lull in power production can be seen. Figure 75 shows data from before the serious winter storm that resulted in those power outages (Penney 2021). Texas power generation from wind lost an average of -7.9 GW (-61%) beginning February 8 before the power crisis began on February 15 (Berman 2023).
Figure 75. Texas power generation from wind lost an average of -7.9 GW (-61%) beginning February 8
(Source: Art Berman, Labyrinth Consulting) (Copyright granted: Art Berman)
The analysis done by Ruhnau & Qvist (2021), who looked at a combination of wind and solar supported the outcomes of previous studies, where periods with persistently scarce supply last no longer than two weeks. However, this same analysis also found that the maximum energy deficit occurs over a much longer period of nine weeks. This happened because it was found that there were multiple examples of more than one scarce power supply period closely follows another. The power storage buffer had not had time to replenish itself. For this reason, Ruhnau & Qvist (2021) recommended a 12-week power storage capacity, to account for storage losses and charging limitations.
As wind is also intermittent in power supply, a power buffer will be required in a similar fashion to Table 44.
8.8 Scenario HA, Exclusive hydroelectric power electricity generation
Scenario HA requires 31 205 GWh of electrical power supplied annually (Table 36). What installed capacity would be required if hydroelectricity supplied 100% of the electrical power needed? According to Table 52 (drawn from Table W3 in Appendix W), the average hydroelectric power electrical power generation station had an installed capacity of 225.0 MW and generated 1 325.7 GWh in the calendar year 2018.
Figure 76. Davis Dam (250MW) on the Colorado River and forms Lake Mohave
(Source/copyright: Creative Commons)
Table 52. Availability and power produced by a globally average sized Hydroelectric station in 2018 (Appendix U)
Table 53. Estimated installed Hydroelectric power generation capacity for Scenario HA (2019 scope)
Table 53 shows that an estimated 24 average sized hydroelectric stations, with a combined installed capacity of 5.3 GW would have to be operating in the State of Hawaiʻi to deliver the annual electricity for Scenario HA.
As an example of an average pumped hydro power station, a flow of 100 m3 of water per second through a turbine/generator operating at 90% efficiency in a system with a head of 570 m would yield electrical power of 500 MW (Blakers et al. 2021). This requires 360 000 m3 of water per 500 MWh (or 720 m3/MW) of energy produced.
Therefore, if Scenario HA requires 31 205 GWh of annual electrical power to be delivered by hydroelectricity, then 22.47 km3 (22.47 billion m3, or 5.93 trillion gallons) of water would need to pass through hydroelectric power stations each year. If the annual total water services and consumption for the State of Hawai'i in 2019 was 72 369 million gallons, then 82 times this quantity would have to be found each year to service hydroelectric power generation.
This is impractical to construct the infrastructure to do this, and it is unclear where the water would come from. Then there is the matter of the geographical siting of so many hydroelectric power stations. The number of viable sites appear to be wholly insufficient to deliver the capacity needed.
It should be noted that the majority of Hawaiʻi’s hydroelectric power generation comes from run-of-the-river. This type of resource is largely considered as having been maximized within the limits of the state’s existing waterways. Additional hydroelectric capacity, as a practical matter, would require damming of waterways to create man-made reservoirs for the purpose of power generation.
8.9 Scenario HA, Exclusive nuclear power electricity generation
Scenario HA requires 31 205 GWh of electrical power annually (Table 36). What installed capacity would be required if nuclear power supplied 100% of the electrical power needed? According to Table 54 (Table W3 in Appendix W), the average nuclear power electrical power generation station had an installed capacity of 2 046.5 MW and generated 12 803.2 GWh in the calendar year 2018.
Figure 77. ENGIE Electrabel - Tihange Power Plant, Huy, Belgium, Commisssioned 1975
(Source: Tihange 2 in 2007. Credit: Michiel Verbeek / Creative Commons)
Table 54. Availability and power produced by a globally average sized nuclear power station in 2018 (Appendix W)
Table 55 shows that an estimated 2 to 3 average sized nuclear power stations, with a combined installed capacity of 5.0 GW would have to be operating in the State of Hawaiʻi to deliver the annual electricity for Scenario HA.
Table 55. Estimated installed nuclear power generation capacity for Scenario HA (2019 scope)
8.10 Scenario HA, Exclusive biomass to energy with Combined Heat and Power (CHP) electricity generation
Scenario HA requires 31 205 GWh of electrical power supplied annually (Table 36). What installed capacity would be required if CHP processing of biowaste supplied 100% of the electrical power needed in Hawaiʻi? According to Table 56 (drawn from Table W3 in Appendix W), the average biowaste to CHP electrical power generation station had an installed capacity of 31.7 MW and generated 34.6 GWh in the calendar year 2018. Appendix Z conducts a more complete discussion on how biomass to waste energy works.
Figure 78. Daicel Corporation, Himeji CHP Plant in Japan. 30MW Gas Turbine (L30A) x 1 unit
(Source: Kawasaki Energy)
Table 56. Availability and power produced by a globally average sized CHP station in 2018 (Appendix U)
Table 57. Estimated installed Combined Heat and Power (CHP) electricity generation capacity for
Scenario HA (2019 scope)
Table 57 shows that an estimated 902 average sized CHP stations, with a combined installed capacity of 28.6 GW, consuming 120.0 million cubic meters of woody biomass (Table 58), would have to be operating in the State of Hawaiʻi to deliver the annual electricity for Scenario HA.
As an estimate, one cubic meter (1 m3) of woody biomass could be used to produce 2 MWh of thermal heat energy, and the further conversion step to produce liquid biofuel from this energy has an average conversion efficiency of 0.6 (Forsström et al., 2012). It is accepted that a conventional biowaste to energy Combined Heat and Power (CHP) plant has a heat energy to electrical power conversion efficiency of 13% (Moran et al. 2014). A cubic meter of wood (volume measured when green), without any water weighs 400 kg; it has a basic density of 400 kg/m3 and a specific gravity of 0.40 (Pious et al. 2016).
Table 58. Estimated woody biomass feedstock for CHP power generation in Scenario HA (2019 scope)
Therefore, 120.0 million cubic meters of woody biomass would have a mass of 48.01 million tonnes. The net mass of food Hawaiʻi consumed in the year 2010 was 0.97 million tonnes (966.6 million kilograms) (Appendix K). This means that if Scenario HA was fueled by woody biomass only, then a mass 49.7 times the annual food consumption would need to be sourced each year.
Table 59. Estimated land area needed for annual harvesting of woody biomass feedstock for CHP power generation in Scenario HA (2019 scope)
In Finland, 2021, forestry land accounts for 26.3 million hectares (101 544.8 miles2 or 263 000 km2) (Luke 2021). The annual increment of the growing stock is 103 million m3 on forest land and poorly productive forest land, and its total volume is more than 2.5 billion m3 (Luke 2020, 2021). This means that the annual increment of growing stock in the forests of Finland was approximately 391 m3/km2 (36 396 cubic feet/miles2). Sustainable harvest means an annual harvesting of biomass at a rate less than the lands’ biosystems’ ability to regrow what was harvested.
For the purposes of this report, it was assumed that Hawaiʻi has measurably more biomass production than Finland and produces annual increment of the growing stock of 600 m3/km2 (54 879 cubic feet/miles2).
Approximately 1.4 million acres (2 188 miles2 or 5 667 km2) of the state are considered forested. Non-forested areas include urban and agricultural areas, recent lava flows, and high elevation sites on Mauna Kea and Mauna Loa on the island of Hawaiʻi and Haleakalā on the island of Maui (USDA Forestry Department). To annually deliver 128.1 million cubic meters of woody biomass, 160 135.7 km2 (60 851.6 miles2) would have to be sustainably harvested each year. This means that an area of forest 34.7 times what is available in Hawaiʻi would need to be sustainably harvested each year (Figure 79).
Figure 79. Land area of forest to be sustainably harvested to annually deliver the needed biomass to CHP plants if all electrical power in Scenario HA was sourced from CHP biomass for the State of Hawai'i 2021, assuming 800 m3/km2 biomass sustainable annual harvest (USDA Dept of Forestry2023)
Figure 79 clearly shows that sourcing all energy needs for scenario HA using biomass is impossible in the State of Hawaiʻi. This was using the traditional woody biomass, that was sustainably harvested from a managed forest. Even using very conservative assumptions, it clearly is not enough capacity for this to be viable.
However, in Scenario HC, a giant perennial grass product specially bred to be an energy source called XanoGrassTM, is used in some of the calculations (Owens 2024, Unnasch & Redmond 2023, Hexas Biomass https://hexas.com/ ). This biomes product has very different metrics to all other conventional biomass sources.
8.11 Scenario HA, Exclusive geothermal electricity generation
Scenario HA requires 31 205 GWh of electrical power supplied annually (Table 11). What installed capacity would be required if geothermal power supplied 100% of the electrical power needed? According to Table 36 (drawn from Table W3 in Appendix W), the average geothermal electrical power generation station had an installed capacity of 94.7 MW and generated 603.2 GWh in the calendar year 2018. Appendix X conducts a more complete discussion of the potential for geothermal power.
Figure 80. Puna Geothermal Venture (PGV) (Image: PGV)
Table 60. Availability and power produced by a globally average sized geothermal power station in 2018 (Appendix U)
Table 61. Estimated installed geothermal station power generation capacity for Scenario HA (2019 scope)
Table 61 shows that an estimated 52 average sized geothermal stations, with a combined installed capacity of 4.9 GW would have to be operating in the State of Hawaiʻi to deliver the annual electricity for Scenario HA.
8.12 Scenario HA, Exclusive wave power electricity generation
Wave power generation is the transport of energy by wind waves, and the capture of that energy to do useful work – for example, electricity generation, water desalination, or the pumping of water (into reservoirs) (Dahlsten 2009). Extracting energy from waves is achieved with floating cylinders which are hinged together using special hinges which are connected to hydraulic generators inside the cylinders.
An example of this type of system is shown in Figures 53, 54 and 55. These cylinders float on the water surface and move relative to each other in response to the wave motion. The relative motion of the cylinders causes the hinges to "flex" which drives the hydraulic generators which then produce electricity as a result (Thomson et al. 2011).
A machine able to exploit wave power is generally known as a wave energy converter (WEC) (Mishra et al. 2016) (Appendix Y). Wave power is distinct from the diurnal flux of tidal power and the steady gyre of ocean currents. Wave-power generation is not currently a widely employed commercial technology, although there have been attempts to use it since at least 1890.
Figure 81. 46.3 Point Absorber (WEC) wave power generation buoyancy unit
(Image by Simon Michaux, using some copyright free clipart)
Figure 82. Wave power air compression power generation schematic simplified diagram
(Image by Tania Michaux)
Figure 83. Wave power generation flex units on wave surface
(Image by Simon Michaux, using some copyright free clipart)
Researchers at the University of Hawaiʻi, (in collaboration with Gerard Nihous Consulting), are developing a small-scale Hawaiʻi Wave Surge Energy Converter (HAWSEC-2022) and are now testing a prototype. The HAWSEC concept is based on the oscillating wave surge converter (OWSC), or flap-type WEC (Appendix Y).
Another option is an Ocean Thermal Energy Conversion (OTEC) unit. OTEC is a process that can produce electricity by using the temperature difference between deep cold ocean water and warm tropical surface waters. OTEC plants pump large quantities of deep cold seawater and surface seawater to run a power cycle and produce electricity (Appendix Y). An experimental OTEC power plant (Kailua-Kona, HI) developed by Makai Ocean Engineering has a capacity of 105 KW (Makai Ocean Engineering, Appendix Y)
Because Hawaiʻi has a highly consistent wave energy resource, the Office of Naval Research is monitoring an experimental wave energy buoy off Kaneohe Marine Corps Base. Hawaiian Electric has facilitated a transmission connection to the electric grid. The 40-kW experimental buoy unit, manufactured by Ocean Power Technologies, Inc. employs the bobbing motion of a buoy to drive an electrical generator (Hawaiian Electric) (Appendix Y).
Figure 84. One of three Pelamis 750 kW (0.75 MW) capacity power
generation machines / Aguçadoura Wave Park off Portugul
Image: S. Portland (Public Domain), (https://commons.wikimedia.org/w/index.php?curid=7952284)
An example of Figure 54 is the Aguçadoura Wave Farm located 3 miles (5 km) offshore near Póvoa de Varzim north of Porto in Portugal (Figure 55), which was the first experimental wave farm. The power generation system (developed by Pelamis Wave Power) is made up of connected sections which flex and bend relative to one another as waves run along the structure. This flexing motion is resisted by hydraulic rams which pump oil through hydraulic motors in a high-pressure circuit, which in turn drive electrical generators. The three machines which made up the Aguçadoura Wave Park were each rated at a peak output of 750 kW, giving an installed peak capacity of 2.25 MW. The farm officially opened on 23 September 2008, by the Portuguese Minister of Economy, and was shut down two months after the official opening in November 2008.
The 750-kW capacity Pelamis unit was used in this report as an example of a wave power generation station. Wave power generation is highly variable and requires a buffer of unknown size to operate.
While wave power happens naturally all of the time (Thomson et al. 2011, and Dahlsten 2009), any machine operating in moving salt water in the past has been notoriously subject to heavy maintenance cycles.
Also, the wave power systems deployed so far have suffered breakdowns with extreme waves. The waves in Hawaiʻi are extremely strong as the island chain are a series of sea mounts, thus the waves are not moderated by a large continental shelf.
For the purpose of this report, it was assumed that a wave power generation unit had an availability of 90%, or 7 884 hours a year (of a possible 8 760 hours). Table 38 shows the performance metrics of several example ocean technology power plants based on the examples from Appendix Y. An availability of 90% was assumed.
Table 62. Availability and power produced by a globally average sized wave/tidal/OTEC power station in 2018, Scenario HA (Thomson et al. 2011, Appendix V)
Table 62 shows most wave/ocean/OTEC systems have an installed capacity of a few hundred kW, resulting in the number of plants needed ranging from 13 000 to 39 000. Tidal energy was able to deliver a much higher capacity (6 and 250 MW). This means that less of them would be needed. Table 63 shows an estimate of the distance between the needed number of plants, given that the tidal shoreline for the State of Hawaiʻi was 1 052 miles (1 693 km) (Table I1, Appendix I). Clearly there are some practical limitations in what is feasible.
Table 63. Estimated installed wave/tidal/OTEC station power generation capacity for Scenario HA (2019 scope)
Additionally, there are restrictions on placing permanent structures in the waterways surrounding the Hawaiian Islands imposed by the US Department of Defense. These restrictions place further limits on the likelihood ocean energy systems will serve as an economically viable source of renewable power for Hawaiʻi.
Appendix Y conducts a more detailed discussion of Ocean Energy’s ongoing research and development.
8.13 Assessment of Scenario HA
Figure 85. Graphical Representation of Scenario HA
The electrification of all transport and industrial systems has been proposed as the foundation of the next global industrial era. Petroleum, with its high energy density, broad range of refined products and its ease of transport, has provided the most effective energy resource the world has ever known. At the time this report was written, every system that contends to replace it demonstrates a lower energy density by volume and, therefore offers less flexibility to ongoing economic activities. It is reasonable to conclude that increased electrification over time will require business to operate in a significantly different manner.
Figure 86. Global Transportation & Logistics – Powererd by Petroleum
(Image: Peter Sternlicht)
In many strategic planning documents, wind and solar have been proposed as the primary power generation systems for the next industrial era. They have been found to be both abundant and cost effective. However, both wind and solar power generation systems are highly intermittent in delivering a steady supply, both requiring a substantial power storage buffer to be viable. The technologies capable of storing such a large quantity of electrical power for longer durations does not yet exist. As long as this remains the case, wind and solar are not viable as the primary source of electrical power for industrialized economies. Like all other technologies, they have their place in a purpose application context.
The electric vehicle is an innovative technology. Society does not yet know how to deploy electrified transportation ‘en masse’. The simple act of refueling an ICE vehicle in just two minutes has no corresponding scenario to “refuel” an electric vehicle.
At the same time the connective infrastructure associated with refueling EVs will be entirely different than we’ve experienced with ICE vehicles. Some vehicles will be charged overnight at personal residences. Others will be charged during the day at employee work sites. Adding hydrogen to the mix of powering EVs will bring another new dimension to the dynamics of operating commercial vehicles. If that course is chosen, much of the connective infrastructure will need to be designed and constructed from scratch.
Recharging an light duty such as a passenger EV used to take 7 or 8 hours. New technological developments have improved this to as little as 30 minutes. However, even this shorter time though, provides a bottleneck when servicing of a large number of vehicles simultaneously. The logistics of this have yet to be effectively designed.
There is a school of thought that says that sufficient quantities of the mineral reserves and natural resources required to manufacture the renewable technology systems capable of replacing our global economic system as it currently functions do not exist. (Michaux 2024). This means that the international market to procure electric vehicles, solar panels, wind turbines and batteries could become highly inelastic. While it may be possible to use other minerals and metals to produce similar systems, all alternative systems will still need copper, nickel, graphite, and cobalt. Clearly human innovation and adaptability are required to resolve these bottlenecks.
9 Scenario HB: All systems are electrified: ALL ICE TRANSPORT IS Substituted with Hydrogen Fuel Cell[46]
Scenario HB (Hawaiʻi Scenario B) was based on what has been widely termed “The Hydrogen Economy”. All Hawaiian Internal Combustion Engine (ICE) vehicles will now be substituted with Hydrogen Fuel Cell Electric Vehicles (FCEV). Hydrogen fuel grid storage will also be examined.
Figure 86. Internal Combustion Engine (ICE), cross section view (Image: Canva)
The hydrogen economy is now often promoted as a possible replacement system to phase out fossil fuels [47]. There are many applications for hydrogen that go beyond transportation. It is hoped that hydrogen could be the fuel to facilitate the decarbonization of:
· Energy intensive industries
· Truck transport
· Aviation
· Maritime activities
· Heating applications (industrial and building heating)
· Stationary H2 Fuel Cell Power Storage (vs. battery systems)
However, hydrogen is not an energy ‘source’. It’s more accurately a ‘carrier’ of electrons that can serve as a power storage medium or a combustible fuel (similar in functional to natural gas). Nor has Hydrogen been found to be abundant in its unbound, pure chemical form in the natural environment. This means that hydrogen as an energy carrier [48] needs to be extracted from other compounds such as methane, biomass, alcohol, or water. In all cases it takes external energy to separate hydrogen from these more complex compounds.
For the purpose of this study, only the hydrogen needed to power transportation via hydrogen fuel cell was included in calculations. Therefore, all the hydrogen considered herein is manufactured via electrolysis[49], compressed or liquified to facilitate portability and then converted into electricity via a fuel cell when used to perform work.
A hydrogen fuel cell vehicle uses an electric motor drivetrain for propulsion as do EVs. This places it in commercial competition with EVs as a replacement for ICE vehicles. A suitable analogy is that hydrogen serves the same purpose as a battery does, both serving as portable energy storage that will power an electric motor.
As mentioned above, hydrogen can be produced from a wide variety of resources and can be used in a wide range of applications including: power generation; as a transport fuel for low/no carbon vehicles; for the chemical industry; and for low/no carbon interior environmental heating. Hydrogen can also be used as a source for high-temperature industrial processes. It is this range of end-use flexibility that makes it attractive as an alternative to many fossil fuels.
To produce 1 kg of hydrogen via electrolysis, it conservatively requires 50.4 kWh (Table 64, US DoE 2019, IRENA 2018, FCH JU 2017) and 2.06 kWh to compress it into storage 700 bar tanks (Vives et al. 2023, calculated as a % of energy content of H2 produced), and the balance of power (BoP) supporting systems and infrastructure required for a power plant to function efficiently is 5.4 kWh/kg, giving a total energy cost of production of 57.86 kWh/kg (Table 64).
‘BAR’ is a metric unit of pressure (Lide 1992), but not part of the International System of Units (SI). It is defined as 100,000 Pa[50] (100 kPa). A pressure of 1 bar is slightly less than the current average atmospheric pressure on Earth at sea level (approximately 1.013 bar). To use hydrogen to produce electricity with a Proton-Exchange Membrane (PEM) fuel cell[51], 1 kg produces 19.98 kWh of electricity (Table 69), assuming a 60 % efficiency (Selmi et al. 2022) and an energy content for hydrogen of 33.33 kWh/kg (US DoE 2024, based on the lower heating value).
The term Hydrogen Economy refers to the proposed strategy of using hydrogen as a low-carbon energy source – replacing petroleum products as a transport fuel for Internal Combustion Engine (ICE) vehicles. Again, hydrogen could be used as a substitute for natural gas as a heating fuel. Hydrogen is attractive because whether it is burned to produce heat or reacted with air in a fuel cell to produce electricity, the only byproduct is water.
Figure 87. Production and use of 1kg of hydrogen in the proposed Hydrogen Economy
(Image: Simon Michaux) (Source: US DoE 2019, EIA, Selmi et al. 2022 and Vives 2023)
The proposed hydrogen economy is shown in Figure 87. The Hydrogen is assumed to be produced using electrolysis, powered with non-fossil fuel based electricity. That hydrogen is then stored and distributed throughout society to be the basic energy source of choice in parallel with electricity. From there, it would be used as a ‘fuel’ to power vehicles like passenger cars, trucks, and ships with the use of fuel cells (current trend is PEM fuel cells). Some hydrogen could also be used in turbines (See Section 9.1) to generate electricity and heat, which could be used in a variety of industrial applications.
· Hydrogen Physics (Source: Thomas 2018)
o 1kg of H2 ↔ 11.1 Nm3 ↔ 33.3 kWh (LHV) and 39.4 kWh (HHV)
o High mass energy density (1kg H2 = 3.77 liters of gasoline
o Low volumetric density (1 Nm3 H2 = 0.34 liters of gasoline)
· Hydrogen Production from water electrolysis (~ 5 kWh/Nm2 H2) (Source: Thomas 2018)
o Energy: +/- 55.2 kWh of electricity ↔ 1kg H2 ↔ 4.9 Nm3 ↔ ±10 liters demineralized water
o Compressed H2 in tank storage at pressure 700 bar requires 2.06 kWh/kg (Vives et al. 2023, calculated as a % of energy content of H2 produced)
· Power production from a hydrogen PEM fuel cell from hydrogen (+/- 60% efficiency) (Selmi et al. 2022)
o Energy: 1kg of H2 ↔ 20 kWh
Table 64. Techno-economic characteristics of AEC (Alkaline Electrolysis Cell) and
PEM (Proton Exchange Membrane) electrolyzers in 2017 and estimated 2025
(Source: IRENA 2018, FCH JU 2017)
Table 64 shows the performance metrics of hydrogen fuel cells. It requires 57.86 kWh to produce 1 kg of hydrogen. It was also assumed that to compress hydrogen to 700 bar pressure for storage will require 2.06 kWh/kg (Vives et al. 2023, calculated as a % of energy content of H2 produced).
9.1 The use of hydrogen as a combustion fuel in a power generation turbine
It has been proposed (IRENA 2019) to use hydrogen as a combustion fuel to turn a turbine to generate electricity (a direct substitution for natural gas in a re-engineered gas turbine). Let’s consider how much hydrogen a General Electric model 9F.04 hydrogen gas turbine (Figure 88) consumes annually. Also, consider what installed capacity would be needed if solar PV power generation was used to produce that hydrogen.
Figure 88. GE 9F.04 288 MW Turbine Generator (Source: GE Vernova)
· The General Electric model 9F.04 hydrogen gas turbine has an installed power of 288 MW (GE Power, Goldmeer 2019). If this turbine was deployed in a combined cycle configuration, it would operate at 60.4% efficiency and in simple cycle at 38.7% (Grigsby 2006). This would make combined cycle more efficient.
o Assuming a 58.5% annual availability (average natural gas turbine in Appendix T), the GE 9F.04 turbine would operate 5 124.6 hours a year. (Table 65)
o This turbine in a combined cycle would then produce 891.4 GWh of electricity a year
o The GE 9F.04 hydrogen gas turbine consumes approximately 23 600 kg (243 500 m3) of hydrogen an hour to output power at 288 MW (GE Power, Goldmeer 2019)
o Thus, the annual consumption of the 9F.04 hydrogen gas turbine operating for 5 124.6 hours would be 112 157 tonnes of hydrogen
o Given it requires 57.86 kWh to produce 1kg of hydrogen with electrolysis and to compress it into storage 700 bar tanks (Table 64), it would require the generation of 7 672,8 GWh of power annually to produce hydrogen for a single 9F.04 turbine (Table 66).
· The average size solar PV power station (installed power of 33.1 MW) could produce 69.0 GWh in Hawai’I, assuming a 19.2% availability across an average year. (Table 43).
o Thus, it would require 138 average sized PV stations (each 33.1 MW installed power) to produce 7,672.8 GWh annually with an installed capacity of 4 562 MW (Table 67)
To support a 288 MW hydrogen turbine that would annually produce 891.4 GWh, a solar PV installed capacity of 4,562 MW would be required to deliver 7,672.8 GWh to manufacture the hydrogen. (Table 67)
Alternatively, the 891.4 GWh could be delivered with solar PV power directly, with 530 MW installed capacity. The difference between a hydrogen turbine supported with solar panels delivering 288 MW compared to delivering the same power quantity directly with solar PV power is a multiplier of 3.9.
Table 65. Annual electricity generated by a hydrogen powered turbine and its annual hydrogen consumption
To deliver the 53 981 GWh of electrical power required in Scenario HB (Section 9.8, Table 74), annually, 61 General Electric model 9F.04, 288 MW hydrogen gas turbines would be needed to be in operation in the State of Hawaiʻi (53,981 / 891.4 = 60.58)
Table 66. Electricity required to produce annual supply of hydrogen for a
General Electric model 9F.04 hydrogen gas turbine
In order to support a single 288 MW hydrogen turbine that would annually produce 891.4 GWh (Table 37), 120,941 tonnes of hydrogen would have to be produced, stored, and transported, requiring 7,672.8 GWh (Table 66) of power to manufacture the clean hydrogen, requiring 4,562 MW of installed capacity of solar PV systems (Table 67).
Table 67. PV system needed to produce 112 157 tonnes of hydrogen (7 115.6 GW).
Alternatively, the 891.4 GWh (Table 65) could be delivered with solar PV power directly, with 530 MW installed capacity (Table 68).
Table 68. Comparison of a PV system capacity needed to produce the same power
as hydrogen powered CHP turbine system
The difference between producing hydrogen with solar panels to fuel a hydrogen powered turbine engine that would then deliver 288 MW of power compared to delivering that 288 MW of power directly with solar PV power is a multiplier of 8.6.
In other words, it takes nearly 9 times more power (7,672.8 / 891.4 = 8.6) to produce the clean hydrogen from solar power than simply using the solar power alone to deliver to the grid what the turbine’s final output of 891.4 GWh would be. Clearly this is not practical or fiscally responsible.
Therefore, it is not reasonable to consider using hydrogen as a combustion fuel in direct power generation using solar for ‘green’ hydrogen production.
9.2 The use of hydrogen for power storage
It has been proposed to use hydrogen as an option to store energy, where power generation in excess to demand load could be used to produce hydrogen with electrolysis (Menton 2022). This is the primary example of chemical energy storage.
Table 69. Electricity produced by a PEM cell from hydrogen fuel
However, given it requires 57.86 kWh to produce 1 kg of hydrogen, and that 1 kg of hydrogen can only deliver 19.98 kWh (EIA 2024d, Selmi et al. 2022) of electricity after being converted back into electricity via a PEM fuel cell, hydrogen as an energy storage would be 34.5 % efficient. While the use of excess available power is a useful task, other power storage methods can be considered (Table 29).
Figure 89. Hydrogen Storage (Image: Canva)
Options in addition to chemical storage (hydrogen) include thermal storage (sensible, latent and thermochemical heat), electrochemical storage (static batteries, flow batteries, metal (iron air batteries among others) mechanical storage (pumped hydro, flywheels, gravity based storage, compressed air and liquid air storage) (LDES, 2024). (also see Table 42)
9.3 Hydrogen Fuel Cell Passenger cars
An example of Hydrogen Fuel Cell passenger technology is the Toyota Mirai, a mid-size passenger 4 door sedan. Under the United States Environmental Protection Agency (EPA) cycle, Toyota Hydrogen fuel cell Mirai Limited has a total range of 357 miles (502 km) on a full tank (5.6 kg of hydrogen in a 142.2 liter tank, with a 5.7 wt% storage density) (Toyota 2024a). Fuel efficiency is reported as 4.4 kW/liter and 4.25 miles/kWh (6.83 km/kWh) with a combined city/highway fuel economy rating of 3.6 L/100 km (0.8 kg/100km, consuming 15 kWh/100km, at a speed of 100km/hr). This makes the Mirai a very fuel-efficient hydrogen fuel cell vehicle as rated by the EPA, and the one with a comparatively long range. The Mirai consumes 1kg of hydrogen to produce 15 kWh of electricity.
This is a partial list of companies currently developing hydrogen fuel cell passenger cars. (Fastech, 2023)
· Toyota: Mirai
· BMW: iX5
· Hyundai: Nexo
· Honda: Clarity, CR-V e:FCEV
· Jaguar Land Rover: Defender DCEV Prototype
· NamX: HUV (Hydrogen Utility Vehicle)
· Hyperion: XP-1 Hypercar
Figure 90. Toyota Mirai, Hydrogen fuel cell automobile
(Kelly Bluebook)
Figure 91. Hyperion XP-1 Hypercar
Hydrogen electric vehicle (Hyperion Motors)
9.4 Hydrogen Fuel Cell Pickup Truck – Ambulance
The Hawaiʻi Department of Transportation did not designate a classification for ambulances. For the purposes of this report, ambulances are modelled within the context of a light duty vehicle or a pickup truck. Toyota has unveiled a prototype hydrogen-fueled pickup truck, Hilux (Toyota 2024b). Three high-pressure fuel tanks are used, giving the Hilux an expected driving range of more than 365 miles. Three tanks, each with a capacity of 2.6 kg, allow these prototypes to store a total of 7.8 kg of compressed hydrogen gas. The hydrogen fuel efficiency could then be estimated at 2.13 kg/100 miles (1.32 kg/100 km).
Toyota Helux – Fuel Cell Pickup Truck
(Toyota)
Zero Emission Rapid Response Operations
Fuel Cell Ambulance (ULEMCo)
Figure 92. H2 Fuel cell Pickup Truck & Ambulance
9.5 Hydrogen Fuel Cell Bus
Battery electric and fuel cell buses are currently pre-commercial technologies and are not yet mass-market products. There are now several models of hydrogen fuel cell buses in development which are nearly ready for full commercialization.
Some of these models are listed here:
Figure 93. AC Transit – Hydrogen Fuelcell Bus
(AC Transit, Oakland, CA)
· Van Hool: Exqui.City 18 FC
· Toyota-Hino: FCHV-BUS
· Hyundai: ElecCity
· Foton Motor: BJ6123FCEVCH-1
· Mercedes-Benz (Daimler AG):
Citaro fuel-cell bus
· Yutong: ZK6125FCEVG1
The average hydrogen consumption of an FCEV bus is estimated to be 8.0 kg/100km (62.14 miles) (Hope-Morley et al. 2017), with an estimated average H2 tank capacity of 27 kg.
9.6 Hydrogen Fuel Cell Heavy Duty Trucks
It has previously been concluded that all long-range vehicles such as trucks should be hydrogen fuel cell powered (Michaux 2021). For each vehicle class, the performance averages of commercially available models were used to represent the whole class in calculating the scope of the hydrogen economy. The Hyundai Motor Company is producing a heavy-duty hydrogen fueled truck (FuelCellsWorks 2020). The first 50 manufactured units were sent to Switzerland in Q3 of 2020 with a planned total of 1600 XCIENT trucks to be manufactured by Hyundai by 2025.
The XCIENT H-cell fueled truck is powered by a 180 kW hydrogen fuel cell system with dual 90 kW fuel cell stacks (Hyundai 2024). Seven large hydrogen fuel tanks offer a combined storage capacity of 31 kg of hydrogen at 350 bar. The driving range of the XCIENT truck is quoted by Hyundai as being 400km (assuming the 4 x 2 model with refrigerated up-fit configuration while operating 34 tonne truck + trailer). This provides a hydrogen fuel consumption efficiency of 12.5 kg/100 miles (7.75 kg/100km). These specifications were developed based on a balance between the optimal requirements from the potential commercial fleet customers. Refueling time is projected to be approximately 8-20 minutes.
The following is a partial list of manufacturers currently developing HDV, hydrogen fuel cell transport systems (Precedence Research 2024).
Nikola
Daimler trucks
Cummins
Hyzonmotors
Toyota/Hino
Volvo
Honda motors
Hyundai motors
SAIC
JMCH
Figure 94. Hino/Toyota HFC Class 8 Tractor, (Hino Motors, Ltd.)
9.7 All Hawaiian ICE vehicles are substituted with hydrogen fuel cell vehicles
To conduct the calculations for Scenario HB, a hydrogen fuel cell vehicle was selected to represent each vehicle class in Hawaiʻi. Tables 70-1 and 70-2 show the performance metrics of selected hydrogen fuel cells. Taking distance traveled data from Section 5.4.3, Table 23 and combining it with data from Tables 71 to 73, the estimated annual quantity of hydrogen that could be needed to fuel the Hawaiian vehicle transport fleet, to do the same physical work done in the year 2019, is shown in Table 72 46.
Table 70-1. Hydrogen fuel cell vehicle examples used to estimate fuel efficiency for vehicle classes - Part 1
Table 70-2. Hydrogen fuel cell vehicle examples used to estimate fuel efficiency for vehicle classes - Part 2
Table 71. Estimated quantity of hydrogen to fuel a complete hydrogen powered transport fleet
(using 2019 Hawaiian transport fleet scope) for Scenario HB
Table 72. Estimation of total electricity required to produce hydrogen
for a H2-Cell Hawaiian transport fleet (2019 scope), excluding aviation, for Scenario HB
Table 73. Estimation of the electrical power generation for an electrified Hawaiian aviation industry
9.8 Electricity demand in Scenario HB
The total power needed to produce hydrogen from Tables 71 to 73 was added to the annual power consumption in Hawaiʻi in Table 4 (and Appendix M), to represent the total annual power generation required for Scenario HB in Table 74.
Table 74. Annual electrical power demand Scenario HB Hydrogen Economy
(based on the 2019 Hawaiian scope of physical work done)
Scenario HB requires 54.0 TWh of annual non fossil fuel power production to be operational in the State of Hawai’i. Note: Power sold in 2019 was 9.2 TWh (Table 7)
9.9 Scenario HB, exclusive solar power electricity generation
Scenario HB requires 53,981 GWh of electrical power supplied annually (Table 74). What would the installed capacity need to be if solar panels supplied 100% of the electrical power needed?
The same analytic model using the same performance metrics in scenario HA to determine the size of a 100% solar photovoltaic grid was repeated here for scenario HB (Needham 2024). Accordingly, a greater area for fixed-tilt ground-mount units was needed and was increased to 34,492 acres. The outcomes of this analysis are shown in Tables 75 and 76.
Table 75 shows that an estimated combined installed capacity of 32.3 GW (71.7 million 450-Watt solar panels) would have to be operating in the State of Hawaiʻi to deliver the annual electricity for Scenario HB.
Table 75. Break down of performance metrics for different types of PV installations
in the proposed Hawaiian solar power grid in Scenario HB
Using the same metrics used in scenario HA (Table 40), Table 76 shows the monthly power production of the proposed Scenario HB 100% solar photovoltaic grid.
Table 76. Estimated electrical power delivered by month for the proposed Hawaiian solar power grid in Scenario HB
Table 77 shows an estimate of the needed number of storage power stations, based on an example recently commissioned in Hawaiʻi (using the same calculations as scenario HA, Table 44). If all new stations’ power capacity was the same size and capacity as the Kapolei Energy Storage example, how many such stations would be needed? Table 77 shows an estimate of the size of the power buffer, for all four buffer sizes previously referenced.
Table 77. Estimated stationary power storage buffer for a range of capacities in Scenario HB
9.10 Scenario HB, exclusive wind power electricity generation
Scenario HB requires 53 981 GWh of electrical power supplied annually (Table 76). What installed capacity would be required if wind turbines supplied 100% of the electrical power needed in Hawaiʻi? According to Table 50, the average wind turbine array electrical power generation station had an installed capacity of 37.2 MW and generated 81.2 GWh in the calendar year 2018.
Table 78. Estimated installed wind turbine array power generation capacity for Scenario HB (2019 scope)
Table 78 shows that an estimated 664 average sized wind farms, with a combined installed capacity of 20,754 GW would have to be operating in the State of Hawaiʻi to deliver the annual electricity for Scenario HB.
If these 3,347 wind turbines were all 6.6 MW capacity Siemens Gamesa units (model 5.X SG 6.6-170), with a rotor diameter of 557.7 feet (170 m) and a swept area of 244,308 square feet (22,697 m2) (Siemens 2023), then they could be put in a large grid (2,788.7 feet x 2,788.7 feet, or 850 m x 850 m), as per Figure 72. Then the total area for these 3,347 wind turbines need for operation would be 466.8 miles2 (1,209.1 km2). Figure 95 shows this area compared to the area of forest land and farming land in the State of Hawaiʻi.
Figure 95. Estimated land area for wind turbines in Scenario HB, compared to forest and natural area acreage, and farming, all islands in in State of Hawai'i 2021 (data taken from Appendix D)
9.11 Scenario HB, exclusive hydroelectric power electricity generation
Scenario HB requires 53,981 GWh of electrical power supplied annually (Table 76). According to Table 52 (drawn from Table W3 in Appendix W), the average hydroelectric power electrical power generation station had an installed capacity of 225.0 MW and generated 1,324.7 GWh in the calendar year 2018.
Table 79. Estimated installed Hydroelectric power generation capacity for Scenario HB (2019 scope)
Table 79 shows that an estimated 41 average sized hydroelectric stations, with a combined installed capacity of 9.17 GW would have to be operating in the State of Hawaiʻi to deliver the annual electricity for Scenario HB.
As an example, an average pumped hydro power station with a flow of 100 m3 of water per second through a turbine/generator operating at 90% efficiency in a system with a head of 570 m will yield electrical power of 500 MW (Blakers et al. 2021). This translates to 360 000 m3 of water being required for each 500 MWh (or 720 m3/MW) of energy produced.
Therefore, if Scenario HB required 54.0 TWh of annual electrical power to be delivered by hydroelectricity, then 38.9 km3 (3.89 x 10¹⁰ m3, or 10.3 trillion gallons) of water would need to pass through hydroelectric power stations each year. If the annual total water services and consumption for the State of Hawai'i in 2019 was 72,369 million gallons, then 142 times this quantity would have to be found each year to service hydroelectric power generation.
With the majority of existing functional opportunities to generate hydroelectric power already in operation, further development of this technology is unrealistic.
9.12 Scenario HB, exclusive nuclear power electricity generation
Scenario HB requires 53,981 GWh of electrical power supplied annually (Table 76). What installed capacity would be required if nuclear power supplied 100% of the electrical power needed? According to Table 54, the average nuclear power electrical power generation station had an installed capacity of 2,046 MW and generated 12,803.2 GWh in the calendar year 2018 (Table W3, Appendix W).
Table 80. Estimated installed Nuclear power generation capacity for Scenario HB (2019 scope)
Table 80 shows that an estimated 4 average sized nuclear stations, with a combined installed capacity of 8.6 GW would have to be operating in the State of Hawaiʻi to deliver the annual electricity for Scenario HB.
While Table 80 shows a literal mathematical translation of nuclear capacity for statewide energy demand and its minimum systems’ deployment based on global deployment averages, Hawaiʻi is not positioned to load-share centrally generated power between its islands. Therefore, deployment within varying capacities and the number of systems would need to be considered for Hawaiʻi to generate all its power from nuclear resources.
9.13 Scenario HB, exclusive biowaste to energy CHP electricity generation
Scenario HB requires 53,981 GWh of electrical power supplied annually (Table 76). What installed capacity would be required if Combined Heat and Power (CHP) processing of biowaste supplied 100% of the electrical power needed? According to Table 29, the average biowaste to energy Combined Heat and Power (CHP) electrical power generation station had an installed capacity of 31.85 MW and generated 34.58 GWh in the calendar year 2018.
Table 81. Estimated installed Combined Heat and Power (CHP) electricity generation capacity
for Scenario HB (2019 scope)
Table 81 shows that an estimated 1,561 average sized CHP stations, with a combined installed capacity of 49.5 GW would be necessary to generate the electricity needed for Scenario HD. Table 54 shows that 207.6 million cubic meters of wood biomass, with a mass of 83 million tonnes, would have to be consumed annually in the State of Hawaiʻi to deliver the electricity for Scenario HB.
Table 82. Estimated wood biomass feedstock for CHP power generation in Scenario HB (2019 scope)
Table 83. Estimated land area needed for annual harvesting of wood biomass feedstock
for CHP power generation in Scenario HB (2019 scope)
The net food consumed in the year 2010 for the state of Hawaiʻi was 966.6 million kilograms (Appendix K). This means that if Scenario HD was fueled by biomass only, then wood biomass 179.2 times the annual food consumption would need to be sourced annually.
To annually deliver 207.6 million cubic meters of wood biomass, 131 491 miles2 (346 029 km2) would have to be sustainably harvested each year. This would be 86 times the total land area for the State of Hawaiʻi (6 422.6 miles Appendix F, Table F2). Thus again, considered unlikely as a solution.
9.14 Scenario HB, exclusive geothermal electricity generation
Scenario HB requires 53 981 GWh of electrical power supplied annually. What installed capacity would be required if geothermal supplied 100% of the electrical power needed? According to Table 32, the average geothermal electrical power generation station had an installed capacity of 94.7 MW and generated 603.2 GWh in the calendar year 2018. Appendix V shows a more complete discussion of the potential for geothermal power.
Table 84. Estimated installed geothermal station power generation capacity for Scenario HB (2019 scope)
Table 56 shows that an estimated 89 average sized geothermal stations, with a combined installed capacity of 8.5 GW would have to be operating in the State of Hawaiʻi to deliver the annual electricity for Scenario HB.
9.15 Scenario HB, exclusive wave power electricity generation
Scenario HB requires 53 981 GWh of electrical power supplied annually, what installed capacity would be required if wave power supplied 100% of the electrical power needed? Appendix W shows a more complete discussion on wave power generation. Table 85 shows the performance metrics of several example ocean technology power plants based on examples from Appendix V. An availability of 90% was assumed.
Table 85. Availability and power produced by a globally average sized wave/tidal/OTEC power station in 2018, Scenario HD (Thomson et al. 2011, Appendix V)
Table 85 shows most wave/ocean/OTEC systems have an installed capacity of a few hundred kW, resulting in the number of plants needed ranging from 23 000 to 68 000. Tidal energy was able to deliver a much higher capacity (6 and 250 MW). This means that less of them would be needed. Table 86 shows an estimate of the distance between the needed number of plants, given that the tidal shoreline for the State of Hawaiʻi was 1 052 miles (1 693 km) (Table I1, Appendix I). Clearly there are some practical limitations in what is feasible.
Table 86. Estimated installed wave/tidal/OTEC station power generation capacity for Scenario HB (2019 scope)
9.16 Assessment of Scenario HB
The hydrogen economy has been proposed as the foundation of the next industrial era in many strategic planning documents. However, there are several practical challenges to the strategic direction.
When comparing electric vehicle systems with hydrogen fuel cell systems doing the same work, it becomes apparent that each system type has advantages and disadvantages. It takes 2.5 times the electrical power to produce hydrogen, compared to the electrical power required to charge an equivalent electrical vehicle. Alternatively, an electric vehicle battery has 3.2 times the weight in mass on average compared to the equivalent fuel tank of a hydrogen fuel cell vehicle. The implication is this: Hydrogen is an energy carrier not an energy source. This means it needs to be produced using energy from somewhere.
Another factor to consider is that hydrogen is very difficult to store due to its very small molecular size. It tends to permeate many of the materials used to contain it and can cause embrittlement[52]. This has presented many technical challenges in the storage and transport of hydrogen. While the technology to produce store and transport hydrogen on a small scale is relatively mature, the technology needed to do so on a larger scale does not yet exist. This means that the storage and production of such as large an amount of hydrogen as is proposed in Scenario HB not viable at the time of writing this report.
That being said, hydrogen fueled systems certainly can have their place in future, non-fossil fuel energy mix. It is recommended that hydrogen fueled systems are deployed in specific purpose-driven applications and considered with a hybrid-solution scenario. Scenario HE, The Green Transition is the first hybrid scenario to be examined in this report.
[1] NOTE: As stated in the Introduction (Section 1), 2019 is being used as a baseline year due to the impacts of the COVID pandemic skewing economic performance in the years immediately following the outbreak. Some calculations are done in reference to the United States federal transport fleet metrics.
[2] The terms ‘electricity’ and ‘power’ will be used interchangeably for narrative composition purposes only. There is no meaningful distinction to be inferred from the use of one term vs. the other.
[3] An analysis for hydrogen and Liquid Organic Hydrogen Carriers (LOHCs) will be explored in Scenario XXX
[4] Externalized fossil fuel consumption is not included in this assessment. For example, the energy consumed during the production and transportation of fuels imported to Hawaiʻi for use in systems such as power generation or the refueling of aircraft, ground and maritime transportation are not included in this assessment, nor is the additional energy required to construct the connective infrastructure this transition will require.
[5] Aggregate data is when multiple data sources are combined into one set to create a larger idea of a particular issue. Conversely, disaggregate data refers to the isolation of one or more variables within a data set (Rogland, 2023)
[6] The Energy Information Administration (EIA) is a statistical and analytical agency within the US Dept. of Energy
[7] A discussion detailing data gathering efforts can be found in Section 5.4.7, Conclusions on Analytical Processes
[8] US Department of Energy, https://www.energy.gov/energy-sources
[9] IPCC, Energy carriers include electricity and heat as well as solid, liquid and gaseous fuels. They occupy intermediate steps in the energy-supply chain between primary sources and end-use applications.
(https://archive.ipcc.ch/publications_and_data/ar4/wg3/en/ch4s4-3-4.html)
[10] DBEDT Data Warehouse and HDOT
[11] OTE, Overall Thermal Efficiency is the quotient of work output divided by thermal energy input.
[12] Diesel has more thermal energy/gallon and a higher OTE than gasoline
[13] Hydrogen production and consumption will be examined in Sections XXX through XXX
[14] Nikola Hydrogen-Electric Simi Truck, https://www.nikolamotor.com/tre-fcev
[15] NASA - Evaluation of a Hydrogen Fuel Cell Powered Blended-Wing-Body Aircraft Concept for Reduced Noise and Emissions https://ntrs.nasa.gov/api/citations/20040033924/downloads/20040033924.pdf
[16] Road transport has some historical performance data from which to perform this analysis. Aviation and Maritime transport do not. Therefore, the Bottom-Up analysis is limited to the observable work performed calculated as power generation equivalencies.
[17] The VMTs reported by both departments, DBEDT and HDOT, employ different categorization definitions surrounding what is classified as a “truck”, making the outcome materially inaccurate using this approach. It should also be noted that VMT data published from each government department referenced differ in their assessments.
[18] Shown to exceed that consumed by ‘Hwy Use” vehicles 79% (Non Hwy) TO 21% (Hwy Use).
[19] This data set does not include Non-Hwy use of LPG (Propane), a fuel widely used for cooking and other residential and commercial heating purposes. Therefore, estimates for its use are excluded from this analysis.
[20] Note: Tables 10-1 and 10-2 represent 100% of each fuel type’s potential energy value expressed as equivalent measurements as defined in Section 5.2.3.
[21] Source: Needham, C. (2024) Analysis and development of a proposed solar power grid for Hawai’i, Azimuth Advisory Services, https://www.azimuth-ventures.com/
[22] Ehsani, M., Gao, Y., Longo, S., and Ebrahimi, K., (2018): Modern Electric, Hybrid Electric, and Fuel Cell Vehicles, 3rd Edition, CRC Press, Boca Raton, eBook ISBN: 9780429504884
Malins, C., (2017): What role is there for electrofuel technologies in European transport’s low carbon future? Cerulogy, Commissioned by Transport and Environment NGO, http://www.cerulogy.com/
[23] This does not include any power generation estimates for producing hydrogen, or other liquid fuel alternatives.
[24] Liquid Fuel Tax Base shown in data gathered from the DBEDT Data Warehouse, Indicator, Energy.
[25] Maritime and aviation activity will be explored individually in Sections 5.5 and 5.6. https://highways.dot.gov/
[26] FHWA – Federal Highway Administration, https://highways.dot.gov/
[27] Appendix XXX, Table XX-XX
[28] Passenger or Commercial
[29] Producing H2 at the point of use may have advantages for large volume users such as aviation or maritime operators.
[30] See Appendix XX, Table XX for a list of body types registered by counties in the State of Hawaiʻi
[31] Section 18 – Transportation, https://dbedt.hawaii.gov/economic/databook/2020-individual/_18/
[32] Fuel types include gasoline (E-10), Low sulfur diesel, hybrid liquid fuel/EV, EV and a miscellaneous fuel type
[33] For the Bottom-Up Calculation-Model 2, Table 22 shows the entire data set representing registered vehicles by county with the subset of diesel vehicles emphasized bold for contextual clarity.
[34] Naphtha is a mixture of liquid hydrocarbons comprising carbon compounds ranging from C5–C9. Naphtha is the main combustible component of both gasoline and kerosene. Naphtha is the main combustible component of both gasoline and kerosene. https://www.sciencedirect.com/topics/engineering/naphtha
[35] Energy Carriers. Energy carriers (sometimes called energy currencies) are the energy forms that we transport and use, and include some energy resources (e.g., fossil fuels) and processed (or secondary) energy forms (e.g., gasoline, electricity, work and heat). The processed energy forms are not found in the environment. (Rosen, EOLSS)
[36] Total Liquids Consumption encompasses the following: Global inland demand of gasoline and diesel, plus international aviation and marine bunker fuels, refinery fuel (gains and loss), crude oil, lease condensate, natural gas plant liquids (NGPL), refined petroleum products, biofuels, and other liquid fuels which can include synthetic fuels and other liquid hydrocarbons not directly derived from crude oil or natural gas.
[37] The 20-year period concluded by Hirsch was contextualized in terms of a cooperative, global mobilization not unlike an allied “war footing” with a deteriorating petroleum infrastructure and flow rate declines serving as the common ‘enemy’.
[38] These figures only represent the end use power needed and does not include estimates for the power required for the support infrastructure required to distribute the power.
[39] Generator nameplate capacity (installed capacity): The maximum rated output of a generator, prime mover, or other electric power production equipment under specific conditions designated by the manufacturer. Installed generator nameplate capacity is commonly expressed in megawatts (MW) and is usually indicated on a nameplate physically attached to the generator (Source: EIA).
[40] Other applications were not considered, as many government strategies assume this will be the only system of energy storage (EMA 2020). Appendix S conducts a more complete discussion on this topic.
[41] The year 2019 was selected, as it was the last year before the COVID-19 pandemic supply chain disruptions. In every year since then there have been unusual data artefacts in the reported data. The purpose of this chart is the show the status of the mining industry as it is now when the global industrial system was stable.
[42] World Resources Institute – Deep Sea Mining Explained (2024)
[43] ‘700-bar” is 10,153 psi. One ‘bar’ is approximately the atmospheric pressure at sea-level (14.5038 psi)
[44] The volume of the water flow and the change in elevation—or fall, and often referred to as ‘head’ (EIA)
[45] The Betz limit, Energy Education (https://energyeducation.ca/encyclopedia/Betz_limit)
[46] Hydrogen fuel cells produce electricity by combining hydrogen and oxygen atoms. The hydrogen reacts with oxygen across an electrochemical cell, similar to a battery, to produce electricity, water, and small amounts of heat. (EIA)
[47] Hydrogen Council 2020, IRENA 2019, IRENA 2018 FCH 2019, COAG 2019, and ITM 2017
[48] Energy Carriers - Energy carriers (sometimes called energy currencies) are the energy forms that we transport and use, and include some energy resources (e.g., fossil fuels) and processed (or secondary) energy forms (e.g., gasoline, electricity, work and heat). The processed energy forms are not found in the environment. (Rosen 1999)
[49] Electrolysis - Electrolysis is the process of using electricity to split water into hydrogen and oxygen. This reaction takes place in a unit called an electrolyzer. Electrolyzers range in size from small, appliance-size equipment that is well-suited for distributed hydrogen production to large-scale, central production facilities that could be tied directly to renewable or other non-greenhouse-gas-emitting forms of electricity production. (Office of Energy Efficiency & Renewable Energy, USDOE; https://www.energy.gov/eere/fuelcells/hydrogen-production-electrolysis)
[50] The pascal (symbol: Pa) is the SI derived unit of pressure or stress (also: Young's modulus and tensile strength). It is a measure of perpendicular force per unit area i.e. equivalent to one newton per square meter or one Joule per cubic meter. (https://www.chemeurope.com/en/encyclopedia/Pascal_%28unit%29.html)
[51] Polymer electrolyte membrane (PEM) fuel cells, also called proton exchange membrane fuel cells, use a proton-conducting polymer membrane as the electrolyte. Hydrogen is typically used as the fuel. These cells operate at relatively low temperatures and can quickly vary their output to meet shifting power demands. PEM fuel cells are the best candidates for powering automobiles. (USDOE)
[52] Hydrogen embrittlement is a degradation process resulting in the reduction of materials' mechanical properties due to the interaction with hydrogen atoms from the component's working environment. (Campari, Ustolin, Alvaro, Paltrinieri, 2023)
Embrittlement is defined as a condition where materials experience significantly reduced strain to failure, especially at low strain rates, even though the flow stress remains relatively unchanged. (Science Direct, chemistry, embrittlement)
[1] This year was chosen as a baseline reference due it being considered the last well documented year prior to COVID’s impact on ‘normal’ economic activity. More recent data is cited where appropriate
[2] Net metering is a billing mechanism that credits solar energy system owners for the electricity they add to the grid thereby reducing their future electric bills. (SEIA-Solar Energy Industries Association)